Project idea – The idea behind this ML project is to build a model for Life Expectancy and Statistical Analysis on factors influencing Life Expectancy
Problem Statement or Business Problem
Although there have been lot of studies undertaken in the past on factors affecting life expectancy considering demographic variables, income composition and mortality rates. It was found that affect of immunization and human development index was not taken into account in the past. Also, some of the past research was done considering linear regression based on data set of one year for all the countries. Hence, this gives motivation to resolve both the factors stated previously by formulating a regression model based on linear regression while considering data from a period of 2000 to 2015 for all the countries. Important immunization like Hepatitis B, Polio and Diphtheria will also be considered. In a nutshell, this study will focus on immunization factors, mortality factors, economic factors, social factors and other health related factors as well. Since the observations this dataset are based on different countries, it will be easier for a country to determine the predicting factor which is contributing to lower value of life expectancy. This will help in suggesting a country which area should be given importance in order to efficiently improve the life expectancy of its population.
Attribute Information or Dataset Details:
About this file:
The Global Health Observatory (GHO) data repository under World Health Organization (WHO) keeps track of the health status as well as many other related factors for all countries The datasets are made available to public for the purpose of health data analysis. The dataset related to life expectancy, health factors for 193 countries has been collected from the same WHO data repository website and its corresponding economic data was collected from United Nation website. Among all categories of health-related factors only those critical factors were chosen which are more representative. It has been observed that in the past 15 years , there has been a huge development in health sector resulting in improvement of human mortality rates especially in the developing nations in comparison to the past 30 years. Therefore, in this project we have considered data from year 2000-2015 for 193 countries for further analysis. The individual data files have been merged together into a single dataset. On initial visual inspection of the data showed some missing values. As the datasets were from WHO, we found no evident errors. Missing data was handled in R software by using Missmap command. The result indicated that most of the missing data was for population, Hepatitis B and GDP. The missing data were from less known countries like Vanuatu, Tonga, Togo,Cabo Verde etc. Finding all data for these countries was difficult and hence, it was decided that we exclude these countries from the final model dataset. The final merged file(final dataset) consists of 22 Columns and 2938 rows which meant 20 predicting variables. All predicting variables was then divided into several broad categories:Immunization related factors, Mortality factors, Economical factors and Social factors.
1) Country
2) Year
3) Status – Developed or Developing status
4) Life expectancy – Life Expectancy in age
5) Adult Mortality – Adult Mortality Rates of both sexes (probability of dying between 15 and 60 years per 1000 population)
6) infant deaths – Number of Infant Deaths per 1000 population
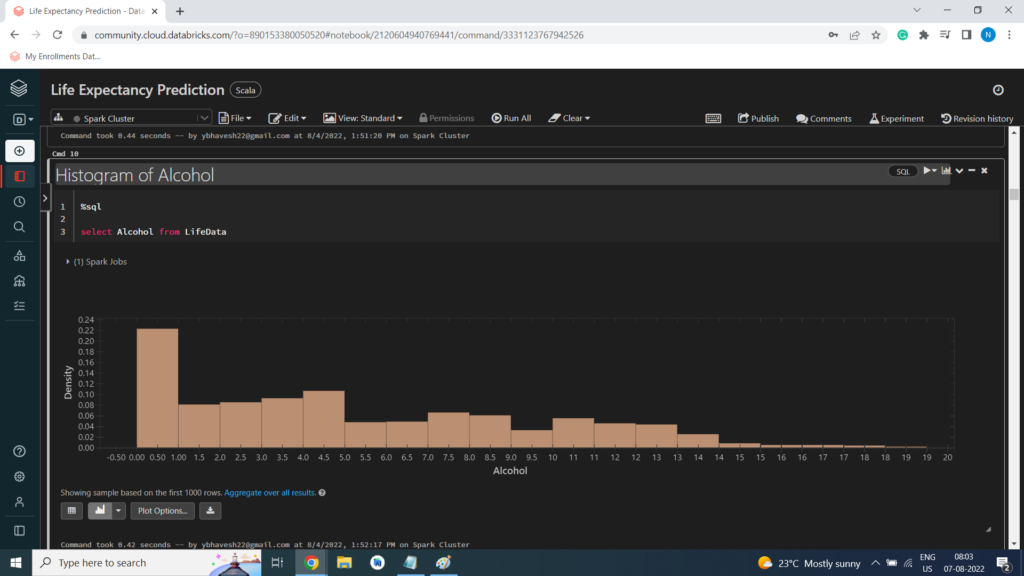
7) Alcohol – Alcohol, recorded per capita (15+) consumption (in litres of pure alcohol)
8) percentage expenditure – Expenditure on health as a percentage of Gross Domestic Product per capita(%)
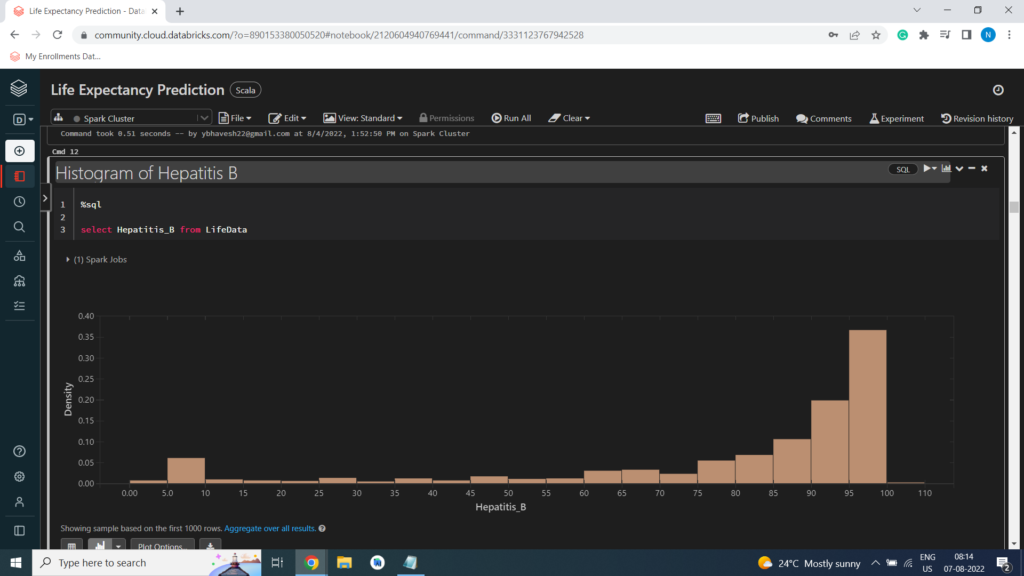
9) Hepatitis B – Hepatitis B (HepB) immunization coverage among 1-year-olds (%)
10) Measles – Measles – number of reported cases per 1000 population
11) BMI – Average Body Mass Index of entire population
12) under-five deaths – Number of under-five deaths per 1000 population
13) Polio – Polio (Pol3) immunization coverage among 1-year-olds (%)
14) Total expenditure – General government expenditure on health as a percentage of total government expenditure (%)
15) Diphtheria – Diphtheria tetanus toxoid and pertussis (DTP3) immunization coverage among 1-year-olds (%)
16) HIV/AIDS – Deaths per 1 000 live births HIV/AIDS (0-4 years)
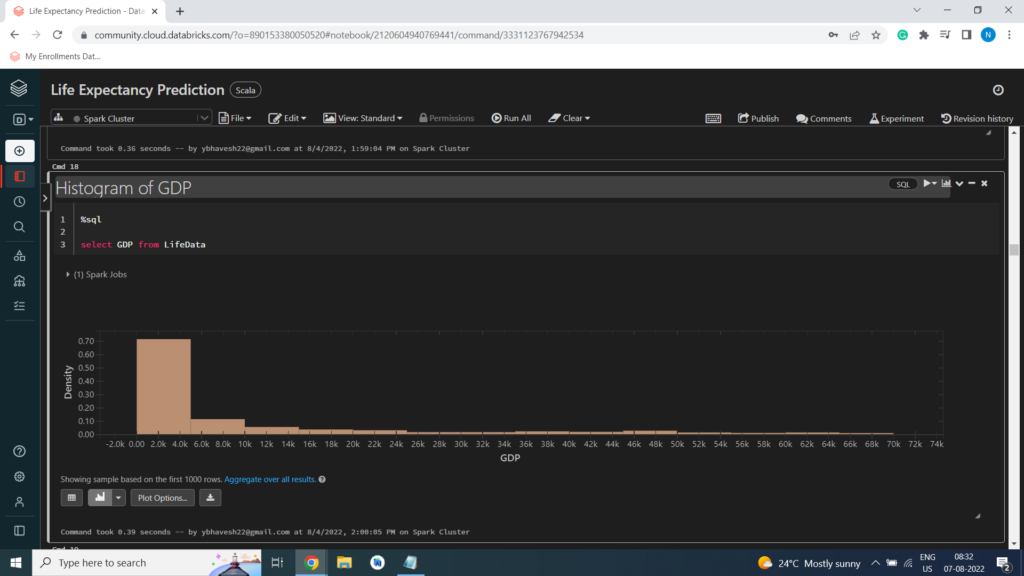
17) GDP – Gross Domestic Product per capita (in USD)
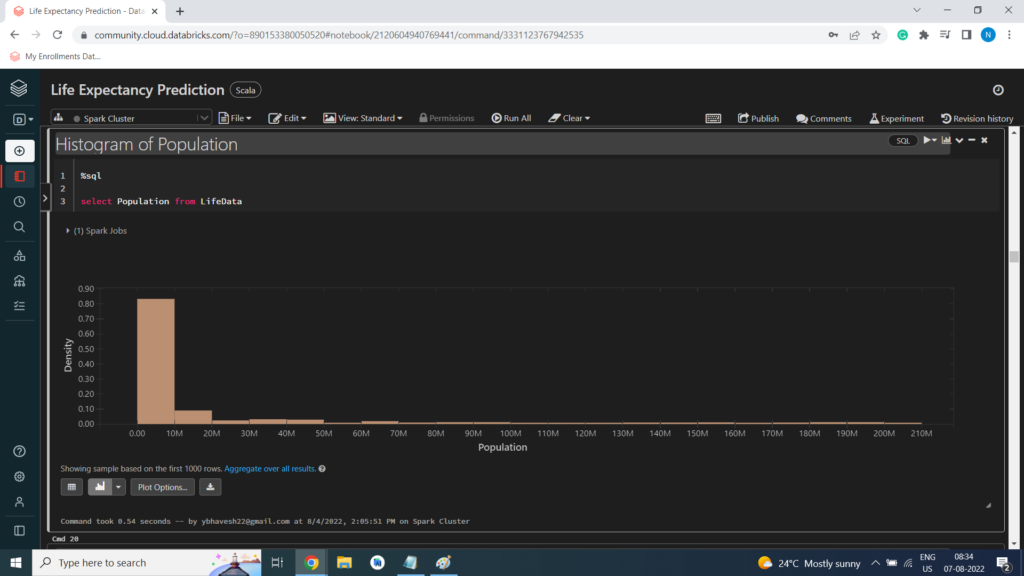
18) Population – Population of the country
19) thinness 1-19 years – Prevalence of thinness among children and adolescents for Age 10 to 19 (% )
20) thinness 5-9 years – Prevalence of thinness among children for Age 5 to 9(%)
21) Income composition – Human Development Index in terms of income composition of resources (index ranging from 0 to 1)
22) Schooling – Number of years of Schooling(years)
Technology Used
Technology Used
- Apache Spark
- Spark SQL
- Apache Spark MLLib
- Scala
- DataFrame-based API
- Databricks Notebook
Introduction
Welcome to this project on Life Expectancy Prediction in Apache Spark Machine Learning using Databricks platform community edition server which allows you to execute your spark code, free of cost on their server just by registering through email id.
In this project, we explore Apache Spark and Machine Learning on the Databricks platform.
I am a firm believer that the best way to learn is by doing. That’s why I haven’t included any purely theoretical lectures in this tutorial: you will learn everything on the way and be able to put it into practice straight away. Seeing the way each feature works will help you learn Apache Spark machine learning thoroughly by heart.
We’re going to look at how to set up a Spark Cluster and get started with that. And we’ll look at how we can then use that Spark Cluster to take data coming into that Spark Cluster, a process that data using a Machine Learning model, and generate some sort of output in the form of a prediction. That’s pretty much what we’re going to learn about the predictive model.
In this project, we will be predict Life Expectancy Prediction
We will learn:
- Preparing the Data for Processing.
- Basics flow of data in Apache Spark, loading data, and working with data, this course shows you how Apache Spark is perfect for a Machine Learning job.
- Learn the basics of Databricks notebook by enrolling in Free Community Edition Server
- Define the Machine Learning Pipeline
- Train a Machine Learning Model
- Testing a Machine Learning Model
- Evaluating a Machine Learning Model (i.e. Examine the Predicted and Actual Values)
- The goal is to provide you with practical tools that will be beneficial for you in the future. While doing that, you’ll develop a model with a real use opportunity.
Free Account creation in Databricks
Creating a Spark Cluster
Creating a Spark Cluster
Basics about Databricks notebook
Loading Data into Databricks Environment
Loading Data into Databricks Environment
Download Data
Load Data in Dataframe using Custom Schema
Load Data in Dataframe using Custom Schema
%scala
import org.apache.spark.sql.Encoders
case class life(Country: String,
Year: Int,
Status: String,
Life_expectancy: Double,
Adult_Mortality: Int,
infant_deaths: Int,
Alcohol: Double,
percentage_expenditure: Double,
Hepatitis_B: Int,
Measles: Int,
BMI: Double,
under_five_deaths: Int,
Polio: Int,
Total_expenditure: Double,
Diphtheria: Int,
HIV_AIDS: Double,
GDP: Double,
Population: Double,
thinness_1_19_years: Double,
thinness_5_9_years: Double,
Income_composition_of_resources: Double,
Schooling: Double)
val lifeSchema = Encoders.product[life].schema
val lifeDF = spark.read.schema(lifeSchema).option(“header”, “true”).csv(“/FileStore/tables/Life_Expectancy_Data.csv”)
display(lifeDF)

Count Data Records
%scala
lifeDF.count()
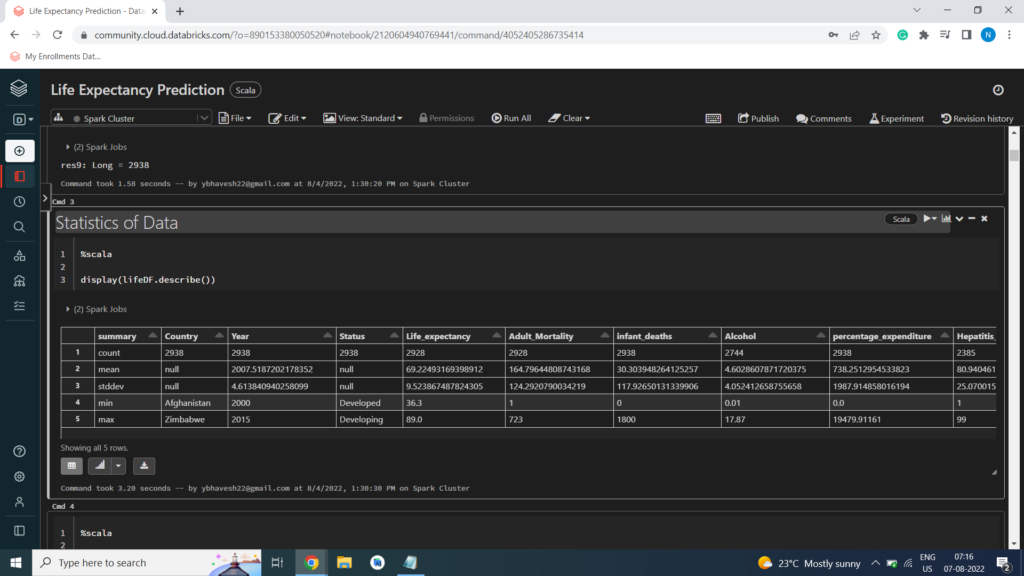
Statistics of Data
%scala
display(lifeDF.describe())
Print Schema of Dataframe
%scala
lifeDF.printSchema()
root
|– Country: string (nullable = true)
|– Year: integer (nullable = true)
|– Status: string (nullable = true)
|– Life_expectancy: double (nullable = true)
|– Adult_Mortality: integer (nullable = true)
|– infant_deaths: integer (nullable = true)
|– Alcohol: double (nullable = true)
|– percentage_expenditure: double (nullable = true)
|– Hepatitis_B: integer (nullable = true)
|– Measles: integer (nullable = true)
|– BMI: double (nullable = true)
|– under_five_deaths: integer (nullable = true)
|– Polio: integer (nullable = true)
|– Total_expenditure: double (nullable = true)
|– Diphtheria: integer (nullable = true)
|– HIV_AIDS: double (nullable = true)
|– GDP: double (nullable = true)
|– Population: double (nullable = true)
|– thinness_1_19_years: double (nullable = true)
|– thinness_5_9_years: double (nullable = true)
|– Income_composition_of_resources: double (nullable = true)
|– Schooling: double (nullable = true)
Exploratory Data Analysis or EDA
Creating Temporary View
%scala
lifeDF.createOrReplaceTempView(“LifeData”)

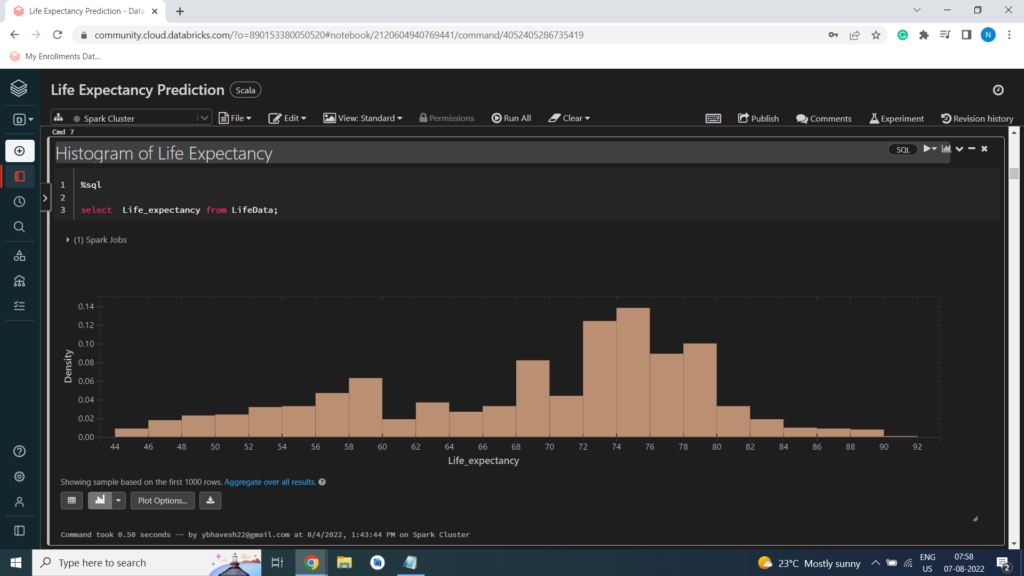
Histogram of Life Expectancy
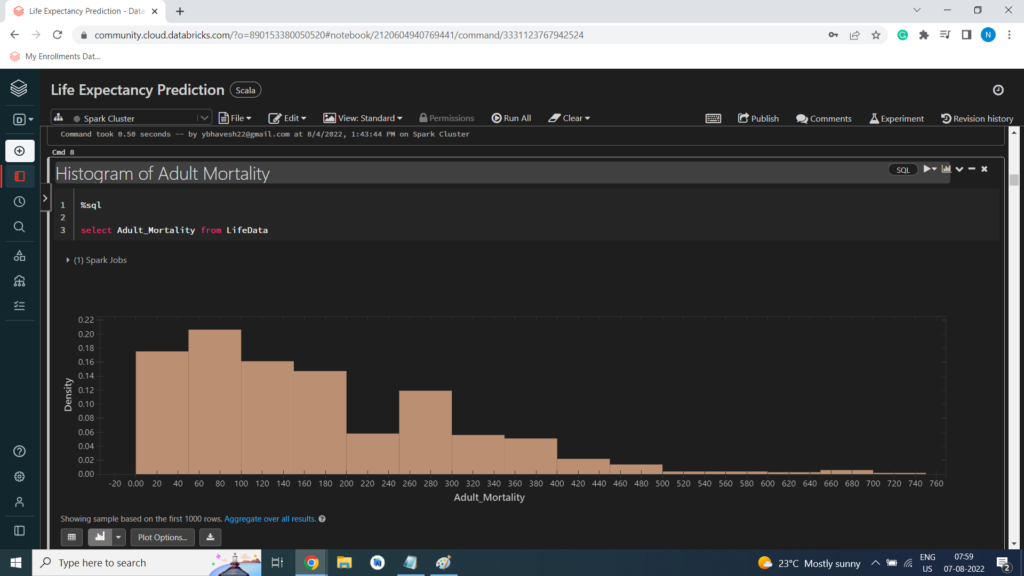
Histogram of Adult Mortality
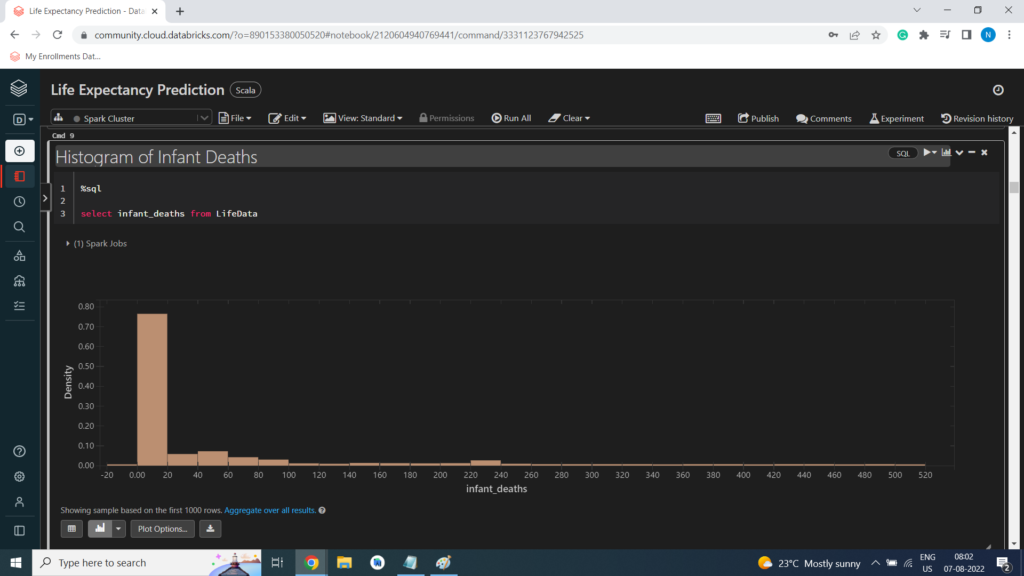
Histogram of Infant Deaths
Histogram of Alcohol
Histogram of Percentage Expenditure

Histogram of Hepatitis B
Histogram of Under Five Deaths

Histogram of Polio

Histogram of Total Expenditure

Histogram of Diphtheria

Histogram of HIV/AIDS

Histogram of GDP
Histogram of Population
Histogram of Thinness 1 to 19 Years

Histogram of Thinness 5 to 9 Years

Histogram of Income Composition Of Resources

Histogram of Schooling

Life Expectancy with respect to Status

Life Expectancy with respect to Country

Life Expectancy with respect to Year