Sales forecasting is the process of estimating future sales. Accurate sales forecasts enable companies to make informed business decisions and predict short-term and long-term performance. Companies can base their forecasts on past sales data, industry-wide comparisons, and economic trends.
It is easier for established companies to predict future sales based on years of past business data. Newly founded companies have to base their forecasts on less-verified information, such as market research and competitive intelligence to forecast their future business.
Sales forecasting gives insight into how a company should manage its workforce, cash flow, and resources. In addition to helping a company allocate its internal resources effectively, predictive sales data is important for businesses when looking to acquire investment capital.
Sales forecasting allows companies to:
Predict achievable sales revenue;
Efficiently allocate resources;
Plan for future growth.
Problem Statement or Business Problem
In this project, looking at the various Stores Sales around the world are tasked with predicting their daily sales in advance. Store sales are influenced by many factors, including promotions, competition, school and state holidays, seasonality, and locality. With thousands of sales records we will be predicting sales based on their unique circumstances, the accuracy of results can be quite varied The task is to forecast the “Sales” column.
Attribute Information or Dataset Details:
To be more understandable, let’s write properties one by one.
Most of the fields are self-explanatory. The following are descriptions for those that aren’t.
- Id – an Id that represents a Store
- Store – a unique Id for each store
- Sales – the turnover for any given day (this is what we are predicting)
- Customers – the number of customers on a given day
- Open – an indicator for whether the store was open: 0 = closed, 1 = open
- StateHoliday – indicates a state holiday. Normally all stores, with few exceptions, are closed on state holidays. Note that all schools are closed on public holidays and weekends. a = public holiday, b = Easter holiday, c = Christmas, 0 = None
- SchoolHoliday – indicates if the (Store) was affected by the closure of public schools
- StoreType – differentiates between 4 different store models: a, b, c, d
- Assortment – describes an assortment level: a = basic, b = extra, c = extended
- CompetitionDistance – distance in meters to the nearest competitor store
- CompetitionOpenSince[Month/Year] – gives the approximate year and month of the time the nearest competitor was opened
- Promo – indicates whether a store is running a promo on that day
- Promo2 – Promo2 is a continuing and consecutive promotion for some stores: 0 = store is not participating, 1 = store is participating
- Promo2Since[Year/Week] – describes the year and calendar week when the store started participating in Promo2
- PromoInterval – describes the consecutive intervals Promo2 is started, naming the months the promotion is started anew. E.g. “Feb,May,Aug,Nov” means each round starts in February, May, August, November of any given year for that store
Technology Used
- Apache Spark
- Spark SQL
- Apache Spark MLLib
- Scala
- DataFrame-based API
- Databricks Notebook
Introduction
Welcome to this project on Sales forecasting or Sales Prediction in Apache Spark Machine Learning using Databricks platform community edition server which allows you to execute your spark code, free of cost on their server just by registering through email id.
In this project, we explore Apache Spark and Machine Learning on the Databricks platform.
I am a firm believer that the best way to learn is by doing. That’s why I haven’t included any purely theoretical lectures in this tutorial: you will learn everything on the way and be able to put it into practice straight away. Seeing the way each feature works will help you learn Apache Spark machine learning thoroughly by heart.
We’re going to look at how to set up a Spark Cluster and get started with that. And we’ll look at how we can then use that Spark Cluster to take data coming into that Spark Cluster, a process that data using a Machine Learning model, and generate some sort of output in the form of a prediction. That’s pretty much what we’re going to learn about the predictive model.
In this project, we will be performing prediction on Store Sales for the day
We will learn:
- Preparing the Data for Processing.
- Basics flow of data in Apache Spark, loading data, and working with data, this course shows you how Apache Spark is perfect for a Machine Learning job.
- Learn the basics of Databricks notebook by enrolling in Free Community Edition Server
- Define the Machine Learning Pipeline
- Train a Machine Learning Model
- Testing a Machine Learning Model
- Evaluating a Machine Learning Model (i.e. Examine the Predicted and Actual Values)
- The goal is to provide you with practical tools that will be beneficial for you in the future. While doing that, you’ll develop a model with a real use opportunity.
I am really excited you are here, I hope you are going to follow all the way to the end of the Project. It is fairly straight forward fairly easy to follow through the article we will show you step by step each line of code & we will explain what it does and why we are doing it.
Free Account creation in Databricks
Creating a Spark Cluster
Basics about Databricks notebook
Loading Data into Databricks Environment
Download Data
Load Data in Dataframe
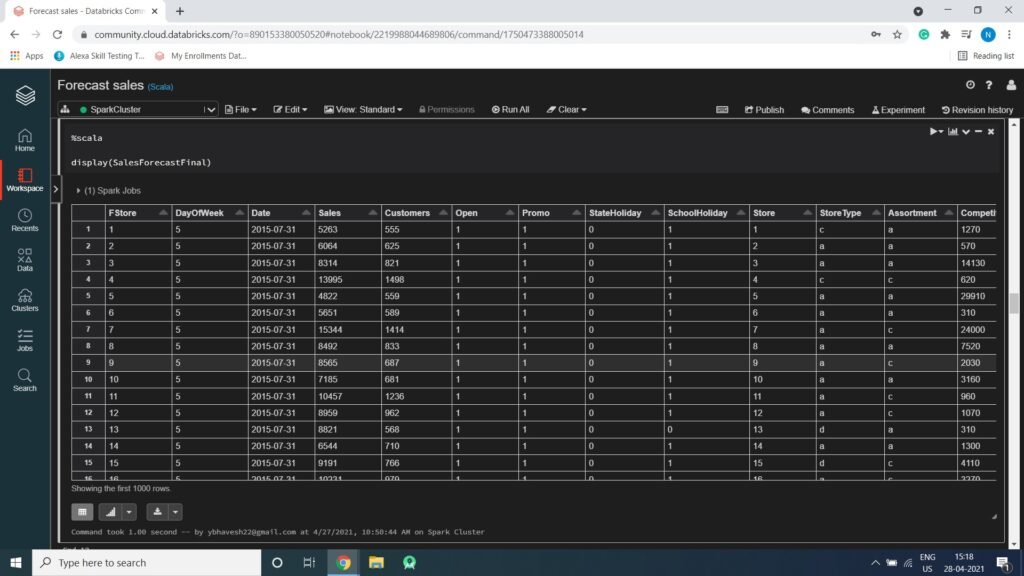
We are loading Data (CSV) file into Dataframe we are using na.fill(0) which will replace null value with Zero(0) and withColumnRenamed(“Store”,”FStore”) this will rename the column Store to FStore.
%scala

val ForecastSaleDF = sqlContext.read.format("csv")
  .option("header", "true")
  .option("inferSchema", "true")
  .option("delimiter", ",")
  .load("/FileStore/tables/train-2.csv").na.fill(0).withColumnRenamed("Store","FStore")

ForecastSaleDF.show()

+------+---------+----------+-----+---------+----+-----+------------+-------------+
|FStore|DayOfWeek|      Date|Sales|Customers|Open|Promo|StateHoliday|SchoolHoliday|
+------+---------+----------+-----+---------+----+-----+------------+-------------+
|     1|        5|2015-07-31| 5263|      555|   1|    1|           0|            1|
|     2|        5|2015-07-31| 6064|      625|   1|    1|           0|            1|
|     3|        5|2015-07-31| 8314|      821|   1|    1|           0|            1|
|     4|        5|2015-07-31|13995|     1498|   1|    1|           0|            1|
|     5|        5|2015-07-31| 4822|      559|   1|    1|           0|            1|
|     6|        5|2015-07-31| 5651|      589|   1|    1|           0|            1|
|     7|        5|2015-07-31|15344|     1414|   1|    1|           0|            1|
|     8|        5|2015-07-31| 8492|      833|   1|    1|           0|            1|
|     9|        5|2015-07-31| 8565|      687|   1|    1|           0|            1|
|    10|        5|2015-07-31| 7185|      681|   1|    1|           0|            1|
|    11|        5|2015-07-31|10457|     1236|   1|    1|           0|            1|
|    12|        5|2015-07-31| 8959|      962|   1|    1|           0|            1|
|    13|        5|2015-07-31| 8821|      568|   1|    1|           0|            0|
|    14|        5|2015-07-31| 6544|      710|   1|    1|           0|            1|
|    15|        5|2015-07-31| 9191|      766|   1|    1|           0|            1|
|    16|        5|2015-07-31|10231|      979|   1|    1|           0|            1|
|    17|        5|2015-07-31| 8430|      946|   1|    1|           0|            1|
|    18|        5|2015-07-31|10071|      936|   1|    1|           0|            1|
|    19|        5|2015-07-31| 8234|      718|   1|    1|           0|            1|
|    20|        5|2015-07-31| 9593|      974|   1|    1|           0|            0|
+------+---------+----------+-----+---------+----+-----+------------+-------------+
only showing top 20 rows
Print Schema of Dataframe
%scala

ForecastSaleDF.printSchema()

Output:

root
 |-- FStore: integer (nullable = false)
 |-- DayOfWeek: integer (nullable = false)
 |-- Date: string (nullable = true)
 |-- Sales: integer (nullable = false)
 |-- Customers: integer (nullable = false)
 |-- Open: integer (nullable = false)
 |-- Promo: integer (nullable = false)
 |-- StateHoliday: string (nullable = true)
 |-- SchoolHoliday: integer (nullable = false)
Load Store Data in Dataframe
%scala

val StoreDF = sqlContext.read.format("csv")
  .option("header", "true")
  .option("inferSchema", "true")
  .option("delimiter", ",")
  .load("/FileStore/tables/store.csv").na.fill(0)

StoreDF.show()

+-----+---------+----------+-------------------+-------------------------+------------------------+------+---------------+---------------+----------------+
|Store|StoreType|Assortment|CompetitionDistance|CompetitionOpenSinceMonth|CompetitionOpenSinceYear|Promo2|Promo2SinceWeek|Promo2SinceYear|   PromoInterval|
+-----+---------+----------+-------------------+-------------------------+------------------------+------+---------------+---------------+----------------+
|    1|        c|         a|               1270|                        9|                    2008|     0|              0|              0|            null|
|    2|        a|         a|                570|                       11|                    2007|     1|             13|           2010| Jan,Apr,Jul,Oct|
|    3|        a|         a|              14130|                       12|                    2006|     1|             14|           2011| Jan,Apr,Jul,Oct|
|    4|        c|         c|                620|                        9|                    2009|     0|              0|              0|            null|
|    5|        a|         a|              29910|                        4|                    2015|     0|              0|              0|            null|
|    6|        a|         a|                310|                       12|                    2013|     0|              0|              0|            null|
|    7|        a|         c|              24000|                        4|                    2013|     0|              0|              0|            null|
|    8|        a|         a|               7520|                       10|                    2014|     0|              0|              0|            null|
|    9|        a|         c|               2030|                        8|                    2000|     0|              0|              0|            null|
|   10|        a|         a|               3160|                        9|                    2009|     0|              0|              0|            null|
|   11|        a|         c|                960|                       11|                    2011|     1|              1|           2012| Jan,Apr,Jul,Oct|
|   12|        a|         c|               1070|                        0|                       0|     1|             13|           2010| Jan,Apr,Jul,Oct|
|   13|        d|         a|                310|                        0|                       0|     1|             45|           2009| Feb,May,Aug,Nov|
|   14|        a|         a|               1300|                        3|                    2014|     1|             40|           2011| Jan,Apr,Jul,Oct|
|   15|        d|         c|               4110|                        3|                    2010|     1|             14|           2011| Jan,Apr,Jul,Oct|
|   16|        a|         c|               3270|                        0|                       0|     0|              0|              0|            null|
|   17|        a|         a|                 50|                       12|                    2005|     1|             26|           2010| Jan,Apr,Jul,Oct|
|   18|        d|         c|              13840|                        6|                    2010|     1|             14|           2012| Jan,Apr,Jul,Oct|
|   19|        a|         c|               3240|                        0|                       0|     1|             22|           2011|Mar,Jun,Sept,Dec|
|   20|        d|         a|               2340|                        5|                    2009|     1|             40|           2014| Jan,Apr,Jul,Oct|
+-----+---------+----------+-------------------+-------------------------+------------------------+------+---------------+---------------+----------------+
only showing top 20 rows
Combining or Joining the Two Dataframe
%scala

val CombinedDF = ForecastSaleDF.join(StoreDF,ForecastSaleDF("FStore") === StoreDF("Store"), "leftouter")

CombinedDF.show()

+------+---------+----------+-----+---------+----+-----+------------+-------------+-----+---------+----------+-------------------+-------------------------+------------------------+------+---------------+---------------+----------------+
|FStore|DayOfWeek|      Date|Sales|Customers|Open|Promo|StateHoliday|SchoolHoliday|Store|StoreType|Assortment|CompetitionDistance|CompetitionOpenSinceMonth|CompetitionOpenSinceYear|Promo2|Promo2SinceWeek|Promo2SinceYear|   PromoInterval|
+------+---------+----------+-----+---------+----+-----+------------+-------------+-----+---------+----------+-------------------+-------------------------+------------------------+------+---------------+---------------+----------------+
|     1|        5|2015-07-31| 5263|      555|   1|    1|           0|            1|    1|        c|         a|               1270|                        9|                    2008|     0|              0|              0|            null|
|     2|        5|2015-07-31| 6064|      625|   1|    1|           0|            1|    2|        a|         a|                570|                       11|                    2007|     1|             13|           2010| Jan,Apr,Jul,Oct|
|     3|        5|2015-07-31| 8314|      821|   1|    1|           0|            1|    3|        a|         a|              14130|                       12|                    2006|     1|             14|           2011| Jan,Apr,Jul,Oct|
|     4|        5|2015-07-31|13995|     1498|   1|    1|           0|            1|    4|        c|         c|                620|                        9|                    2009|     0|              0|              0|            null|
|     5|        5|2015-07-31| 4822|      559|   1|    1|           0|            1|    5|        a|         a|              29910|                        4|                    2015|     0|              0|              0|            null|
|     6|        5|2015-07-31| 5651|      589|   1|    1|           0|            1|    6|        a|         a|                310|                       12|                    2013|     0|              0|              0|            null|
|     7|        5|2015-07-31|15344|     1414|   1|    1|           0|            1|    7|        a|         c|              24000|                        4|                    2013|     0|              0|              0|            null|
|     8|        5|2015-07-31| 8492|      833|   1|    1|           0|            1|    8|        a|         a|               7520|                       10|                    2014|     0|              0|              0|            null|
|     9|        5|2015-07-31| 8565|      687|   1|    1|           0|            1|    9|        a|         c|               2030|                        8|                    2000|     0|              0|              0|            null|
|    10|        5|2015-07-31| 7185|      681|   1|    1|           0|            1|   10|        a|         a|               3160|                        9|                    2009|     0|              0|              0|            null|
|    11|        5|2015-07-31|10457|     1236|   1|    1|           0|            1|   11|        a|         c|                960|                       11|                    2011|     1|              1|           2012| Jan,Apr,Jul,Oct|
|    12|        5|2015-07-31| 8959|      962|   1|    1|           0|            1|   12|        a|         c|               1070|                        0|                       0|     1|             13|           2010| Jan,Apr,Jul,Oct|
|    13|        5|2015-07-31| 8821|      568|   1|    1|           0|            0|   13|        d|         a|                310|                        0|                       0|     1|             45|           2009| Feb,May,Aug,Nov|
|    14|        5|2015-07-31| 6544|      710|   1|    1|           0|            1|   14|        a|         a|               1300|                        3|                    2014|     1|             40|           2011| Jan,Apr,Jul,Oct|
|    15|        5|2015-07-31| 9191|      766|   1|    1|           0|            1|   15|        d|         c|               4110|                        3|                    2010|     1|             14|           2011| Jan,Apr,Jul,Oct|
|    16|        5|2015-07-31|10231|      979|   1|    1|           0|            1|   16|        a|         c|               3270|                        0|                       0|     0|              0|              0|            null|
|    17|        5|2015-07-31| 8430|      946|   1|    1|           0|            1|   17|        a|         a|                 50|                       12|                    2005|     1|             26|           2010| Jan,Apr,Jul,Oct|
|    18|        5|2015-07-31|10071|      936|   1|    1|           0|            1|   18|        d|         c|              13840|                        6|                    2010|     1|             14|           2012| Jan,Apr,Jul,Oct|
|    19|        5|2015-07-31| 8234|      718|   1|    1|           0|            1|   19|        a|         c|               3240|                        0|                       0|     1|             22|           2011|Mar,Jun,Sept,Dec|
|    20|        5|2015-07-31| 9593|      974|   1|    1|           0|            0|   20|        d|         a|               2340|                        5|                    2009|     1|             40|           2014| Jan,Apr,Jul,Oct|
+------+---------+----------+-----+---------+----+-----+------------+-------------+-----+---------+----------+-------------------+-------------------------+------------------------+------+---------------+---------------+----------------+
only showing top 20 rows
Print Schema of Dataframe
%scala

CombinedDF.printSchema()

Output:

root
 |-- FStore: integer (nullable = false)
 |-- DayOfWeek: integer (nullable = false)
 |-- Date: string (nullable = true)
 |-- Sales: integer (nullable = false)
 |-- Customers: integer (nullable = false)
 |-- Open: integer (nullable = false)
 |-- Promo: integer (nullable = false)
 |-- StateHoliday: string (nullable = true)
 |-- SchoolHoliday: integer (nullable = false)
 |-- Store: integer (nullable = true)
 |-- StoreType: string (nullable = true)
 |-- Assortment: string (nullable = true)
 |-- CompetitionDistance: integer (nullable = true)
 |-- CompetitionOpenSinceMonth: integer (nullable = true)
 |-- CompetitionOpenSinceYear: integer (nullable = true)
 |-- Promo2: integer (nullable = true)
 |-- Promo2SinceWeek: integer (nullable = true)
 |-- Promo2SinceYear: integer (nullable = true)
 |-- PromoInterval: string (nullable = true)
Statistics of Data
%scala

val statsofCombinedDF = CombinedDF.describe()

statsofCombinedDF.show()

Output:

+-------+-----------------+-----------------+----------+-----------------+------------------+-------------------+-------------------+------------+-------------------+-----------------+---------+----------+-------------------+-------------------------+------------------------+-------------------+------------------+------------------+----------------+
|summary|           FStore|        DayOfWeek|      Date|            Sales|         Customers|               Open|              Promo|StateHoliday|      SchoolHoliday|            Store|StoreType|Assortment|CompetitionDistance|CompetitionOpenSinceMonth|CompetitionOpenSinceYear|             Promo2|   Promo2SinceWeek|   Promo2SinceYear|   PromoInterval|
+-------+-----------------+-----------------+----------+-----------------+------------------+-------------------+-------------------+------------+-------------------+-----------------+---------+----------+-------------------+-------------------------+------------------------+-------------------+------------------+------------------+----------------+
|  count|          1017209|          1017209|   1017209|          1017209|           1017209|            1017209|            1017209|     1017209|            1017209|          1017209|  1017209|   1017209|            1017209|                  1017209|                 1017209|            1017209|           1017209|           1017209|          509178|
|   mean|558.4297268309659|3.998340557348588|      null|5773.818972305593| 633.1459464082602| 0.8301066939045958| 0.3815145166824124|         0.0|0.17864666946517382|558.4297268309659|     null|      null|  5415.982074480269|        4.926878350466817|      1370.1725112538327| 0.5005637976069814|11.647665327381098|1007.0106084393669|            null|
| stddev|321.9086511434535| 1.99739096494053|      null|3849.926175234754|464.41173388663157|0.37553922469319545|0.48575860487742045|         0.0|0.38305636818092614|321.9086511434535|     null|      null|  7710.252707772823|        4.283543166394769|       935.3634476298038|0.49999992790271613|15.323928205094141|1005.8769300177149|            null|
|    min|                1|                1|2013-01-01|                0|                 0|                  0|                  0|           0|                  0|                1|        a|         a|                  0|                        0|                       0|                  0|                 0|                 0| Feb,May,Aug,Nov|
|    max|             1115|                7|2015-07-31|            41551|              7388|                  1|                  1|           c|                  1|             1115|        d|         c|              75860|                       12|                    2015|                  1|                50|              2015|Mar,Jun,Sept,Dec|
+-------+-----------------+-----------------+----------+-----------------+------------------+-------------------+-------------------+------------+-------------------+-----------------+---------+----------+-------------------+-------------------------+------------------------+-------------------+------------------+------------------+----------------+
Collecting all String Columns into an Array
%scala

var StringfeatureCol = Array("Date", "StateHoliday", "StoreType", "Assortment", "PromoInterval")
StringIndexer encodes a string column of labels to a column of label indices.
Example of StringIndexer
%scala

import org.apache.spark.ml.feature.StringIndexer

val df = spark.createDataFrame(
  Seq((0, "a"), (1, "b"), (2, "c"), (3, "a"), (4, "a"), (5, "c"))
).toDF("id", "category")

val indexer = new StringIndexer()
  .setInputCol("category")
  .setOutputCol("categoryIndex")

val indexed = indexer.fit(df).transform(df)

indexed.show()

Output:

+---+--------+
| id|category|
+---+--------+
|  0|       a|
|  1|       b|
|  2|       c|
|  3|       a|
|  4|       a|
|  5|       c|
+---+--------+

+---+--------+-------------+
| id|category|categoryIndex|
+---+--------+-------------+
|  0|       a|          0.0|
|  1|       b|          2.0|
|  2|       c|          1.0|
|  3|       a|          0.0|
|  4|       a|          0.0|
|  5|       c|          1.0|
+---+--------+-------------+
Define the Pipeline
A predictive model often requires multiple stages of feature preparation.
A pipeline consists of a series of transformer and estimator stages that typically prepare a DataFrame for modeling and then train a predictive model.
In this case, you will create a pipeline with stages:
- A StringIndexer estimator that converts string values to indexes for categorical features
- A VectorAssembler that combines categorical features into a single vector
%scala

import org.apache.spark.ml.attribute.Attribute
import org.apache.spark.ml.feature.{IndexToString, StringIndexer}
import org.apache.spark.ml.{Pipeline, PipelineModel}

val indexers = StringfeatureCol.map { colName =>
  new StringIndexer().setHandleInvalid("keep").setInputCol(colName).setOutputCol(colName + "_indexed")
}

val pipeline = new Pipeline()
                    .setStages(indexers)

val SalesForecastFinal = pipeline.fit(CombinedDF).transform(CombinedDF)
Print Schema to view String Columns are converted into equivalent Numerical Columns
%scala

SalesForecastFinal.printSchema()

Output:

root
 |-- FStore: integer (nullable = false)
 |-- DayOfWeek: integer (nullable = false)
 |-- Date: string (nullable = true)
 |-- Sales: integer (nullable = false)
 |-- Customers: integer (nullable = false)
 |-- Open: integer (nullable = false)
 |-- Promo: integer (nullable = false)
 |-- StateHoliday: string (nullable = true)
 |-- SchoolHoliday: integer (nullable = false)
 |-- Store: integer (nullable = true)
 |-- StoreType: string (nullable = true)
 |-- Assortment: string (nullable = true)
 |-- CompetitionDistance: integer (nullable = true)
 |-- CompetitionOpenSinceMonth: integer (nullable = true)
 |-- CompetitionOpenSinceYear: integer (nullable = true)
 |-- Promo2: integer (nullable = true)
 |-- Promo2SinceWeek: integer (nullable = true)
 |-- Promo2SinceYear: integer (nullable = true)
 |-- PromoInterval: string (nullable = true)
 |-- Date_indexed: double (nullable = false)
 |-- StateHoliday_indexed: double (nullable = false)
 |-- StoreType_indexed: double (nullable = false)
 |-- Assortment_indexed: double (nullable = false)
 |-- PromoInterval_indexed: double (nullable = false)
Display Data
Statistics of Combined Data
%scala

val StatisticsofFinalDF = SalesForecastFinal.describe()

display(StatisticsofFinalDF)

Splitting the Date column of String Data Type and Convert into 3 Numeric columns (Year, Month, Day)
%scala

import spark.sqlContext.implicits._
import org.apache.spark.sql.functions._
import org.apache.spark.sql.functions.col
import org.apache.spark.sql.types.IntegerType

val SalesForecastFinalDF = SalesForecastFinal.withColumn("Year",split(col("Date"),"-").getItem(0).cast(IntegerType))
    .withColumn("Month",split(col("Date"),"-").getItem(1)cast(IntegerType))
    .withColumn("Day",split(col("Date"),"-").getItem(2)cast(IntegerType))


SalesForecastFinalDF.show()

+------+---------+----------+-----+---------+----+-----+------------+-------------+-----+---------+----------+-------------------+-------------------------+------------------------+------+---------------+---------------+----------------+------------+--------------------+-----------------+------------------+---------------------+----+-----+---+
|FStore|DayOfWeek|      Date|Sales|Customers|Open|Promo|StateHoliday|SchoolHoliday|Store|StoreType|Assortment|CompetitionDistance|CompetitionOpenSinceMonth|CompetitionOpenSinceYear|Promo2|Promo2SinceWeek|Promo2SinceYear|   PromoInterval|Date_indexed|StateHoliday_indexed|StoreType_indexed|Assortment_indexed|PromoInterval_indexed|Year|Month|Day|
+------+---------+----------+-----+---------+----+-----+------------+-------------+-----+---------+----------+-------------------+-------------------------+------------------------+------+---------------+---------------+----------------+------------+--------------------+-----------------+------------------+---------------------+----+-----+---+
|     1|        5|2015-07-31| 5263|      555|   1|    1|           0|            1|    1|        c|         a|               1270|                        9|                    2008|     0|              0|              0|            null|       756.0|                 0.0|              2.0|               0.0|                  3.0|2015|    7| 31|
|     2|        5|2015-07-31| 6064|      625|   1|    1|           0|            1|    2|        a|         a|                570|                       11|                    2007|     1|             13|           2010| Jan,Apr,Jul,Oct|       756.0|                 0.0|              0.0|               0.0|                  0.0|2015|    7| 31|
|     3|        5|2015-07-31| 8314|      821|   1|    1|           0|            1|    3|        a|         a|              14130|                       12|                    2006|     1|             14|           2011| Jan,Apr,Jul,Oct|       756.0|                 0.0|              0.0|               0.0|                  0.0|2015|    7| 31|
|     4|        5|2015-07-31|13995|     1498|   1|    1|           0|            1|    4|        c|         c|                620|                        9|                    2009|     0|              0|              0|            null|       756.0|                 0.0|              2.0|               1.0|                  3.0|2015|    7| 31|
|     5|        5|2015-07-31| 4822|      559|   1|    1|           0|            1|    5|        a|         a|              29910|                        4|                    2015|     0|              0|              0|            null|       756.0|                 0.0|              0.0|               0.0|                  3.0|2015|    7| 31|
|     6|        5|2015-07-31| 5651|      589|   1|    1|           0|            1|    6|        a|         a|                310|                       12|                    2013|     0|              0|              0|            null|       756.0|                 0.0|              0.0|               0.0|                  3.0|2015|    7| 31|
|     7|        5|2015-07-31|15344|     1414|   1|    1|           0|            1|    7|        a|         c|              24000|                        4|                    2013|     0|              0|              0|            null|       756.0|                 0.0|              0.0|               1.0|                  3.0|2015|    7| 31|
|     8|        5|2015-07-31| 8492|      833|   1|    1|           0|            1|    8|        a|         a|               7520|                       10|                    2014|     0|              0|              0|            null|       756.0|                 0.0|              0.0|               0.0|                  3.0|2015|    7| 31|
|     9|        5|2015-07-31| 8565|      687|   1|    1|           0|            1|    9|        a|         c|               2030|                        8|                    2000|     0|              0|              0|            null|       756.0|                 0.0|              0.0|               1.0|                  3.0|2015|    7| 31|
|    10|        5|2015-07-31| 7185|      681|   1|    1|           0|            1|   10|        a|         a|               3160|                        9|                    2009|     0|              0|              0|            null|       756.0|                 0.0|              0.0|               0.0|                  3.0|2015|    7| 31|
|    11|        5|2015-07-31|10457|     1236|   1|    1|           0|            1|   11|        a|         c|                960|                       11|                    2011|     1|              1|           2012| Jan,Apr,Jul,Oct|       756.0|                 0.0|              0.0|               1.0|                  0.0|2015|    7| 31|
|    12|        5|2015-07-31| 8959|      962|   1|    1|           0|            1|   12|        a|         c|               1070|                        0|                       0|     1|             13|           2010| Jan,Apr,Jul,Oct|       756.0|                 0.0|              0.0|               1.0|                  0.0|2015|    7| 31|
|    13|        5|2015-07-31| 8821|      568|   1|    1|           0|            0|   13|        d|         a|                310|                        0|                       0|     1|             45|           2009| Feb,May,Aug,Nov|       756.0|                 0.0|              1.0|               0.0|                  1.0|2015|    7| 31|
|    14|        5|2015-07-31| 6544|      710|   1|    1|           0|            1|   14|        a|         a|               1300|                        3|                    2014|     1|             40|           2011| Jan,Apr,Jul,Oct|       756.0|                 0.0|              0.0|               0.0|                  0.0|2015|    7| 31|
|    15|        5|2015-07-31| 9191|      766|   1|    1|           0|            1|   15|        d|         c|               4110|                        3|                    2010|     1|             14|           2011| Jan,Apr,Jul,Oct|       756.0|                 0.0|              1.0|               1.0|                  0.0|2015|    7| 31|
|    16|        5|2015-07-31|10231|      979|   1|    1|           0|            1|   16|        a|         c|               3270|                        0|                       0|     0|              0|              0|            null|       756.0|                 0.0|              0.0|               1.0|                  3.0|2015|    7| 31|
|    17|        5|2015-07-31| 8430|      946|   1|    1|           0|            1|   17|        a|         a|                 50|                       12|                    2005|     1|             26|           2010| Jan,Apr,Jul,Oct|       756.0|                 0.0|              0.0|               0.0|                  0.0|2015|    7| 31|
|    18|        5|2015-07-31|10071|      936|   1|    1|           0|            1|   18|        d|         c|              13840|                        6|                    2010|     1|             14|           2012| Jan,Apr,Jul,Oct|       756.0|                 0.0|              1.0|               1.0|                  0.0|2015|    7| 31|
|    19|        5|2015-07-31| 8234|      718|   1|    1|           0|            1|   19|        a|         c|               3240|                        0|                       0|     1|             22|           2011|Mar,Jun,Sept,Dec|       756.0|                 0.0|              0.0|               1.0|                  2.0|2015|    7| 31|
|    20|        5|2015-07-31| 9593|      974|   1|    1|           0|            0|   20|        d|         a|               2340|                        5|                    2009|     1|             40|           2014| Jan,Apr,Jul,Oct|       756.0|                 0.0|              1.0|               0.0|                  0.0|2015|    7| 31|
+------+---------+----------+-----+---------+----+-----+------------+-------------+-----+---------+----------+-------------------+-------------------------+------------------------+------+---------------+---------------+----------------+------------+--------------------+-----------------+------------------+---------------------+----+-----+---+
only showing top 20 rows
Split the Data
It is common practice when building machine learning models to split the source data, using some of it to train the model and reserving some to test the trained model. In this project, you will use 70% of the data for training, and reserve 30% for testing.
%scala

val splits = SalesForecastFinalDF.randomSplit(Array(0.7, 0.3))
val train = splits(0)
val test = splits(1)
val train_rows = train.count()
val test_rows = test.count()
println("Training Rows: " + train_rows + " Testing Rows: " + test_rows)
Prepare the Training Data
To train the Regression model, you need a training data set that includes a vector of numeric features, and a label column. In this project, you will use the VectorAssembler class to transform the feature columns into a vector, and then rename the Sales column to the label.
VectorAssembler()
VectorAssembler(): is a transformer that combines a given list of columns into a single vector column. It is useful for combining raw features and features generated by different feature transformers into a single feature vector, in order to train ML models like logistic regression and decision trees.
VectorAssembler accepts the following input column types: all numeric types, boolean type, and vector type.
In each row, the values of the input columns will be concatenated into a vector in the specified order.
%scala

import org.apache.spark.ml.feature.VectorAssembler

val assembler = new VectorAssembler().setInputCols(Array("Store", "DayOfWeek", "Customers", "Open", "Promo", "StateHoliday_indexed", "SchoolHoliday",	"StoreType_indexed", "Assortment_indexed", "CompetitionDistance", "CompetitionOpenSinceMonth", "CompetitionOpenSinceYear", "Promo2", "Promo2SinceWeek",	"Promo2SinceYear", "PromoInterval_indexed", "Year",	"Month", "Day")).setOutputCol("features")

val training = assembler.transform(train).select($"features", $"Sales".alias("label"))

training.show()

Output:

+--------------------+-----+
|            features|label|
+--------------------+-----+
|[1.0,1.0,697.0,1....| 6714|
|[1.0,1.0,574.0,1....| 5377|
|[1.0,1.0,574.0,1....| 5575|
|[1.0,1.0,589.0,1....| 5591|
|[1.0,1.0,453.0,1....| 3551|
|[1.0,1.0,577.0,1....| 5280|
|(19,[0,1,5,7,9,10...|    0|
|[1.0,1.0,607.0,1....| 5774|
|[1.0,1.0,502.0,1....| 4071|
|[1.0,1.0,489.0,1....| 3846|
|[1.0,1.0,540.0,1....| 4359|
|[1.0,1.0,553.0,1....| 5054|
|[1.0,2.0,589.0,1....| 6206|
|[1.0,2.0,555.0,1....| 4163|
|[1.0,2.0,535.0,1....| 4648|
|[1.0,2.0,416.0,1....| 3037|
|[1.0,2.0,514.0,1....| 4564|
|[1.0,2.0,438.0,1....| 3547|
|[1.0,2.0,546.0,1....| 5235|
|[1.0,2.0,479.0,1....| 4211|
+--------------------+-----+
only showing top 20 rows
Train a Regression Model
Next, you need to train a regression model using the training data. To do this, create an instance of the LinearRegression algorithm you want to use and use its fit method to train a model based on the training DataFrame. In this project, you will use a Linear Regression algorithm – though you can use the same technique for any of the regression algorithms supported in the spark.ml API
%scala

import org.apache.spark.ml.regression.LinearRegression

val lr = new LinearRegression().setLabelCol("label").setFeaturesCol("features").setMaxIter(10).setRegParam(0.3)
val model = lr.fit(training)
println("Model Trained!")
Prepare the Testing Data
Now that you have a trained model, you can test it using the testing data you reserved previously. First, you need to prepare the testing data in the same way as you did the training data by transforming the feature columns into a vector. This time you’ll rename the Sales column to trueLabel.
%scala

val testing = assembler.transform(test).select($"features", $"Sales".alias("trueLabel"))
testing.show()

Output:

+--------------------+-----+
|            features|label|
+--------------------+-----+
|[1.0,1.0,697.0,1....| 6714|
|[1.0,1.0,574.0,1....| 5377|
|[1.0,1.0,574.0,1....| 5575|
|[1.0,1.0,589.0,1....| 5591|
|[1.0,1.0,453.0,1....| 3551|
|[1.0,1.0,577.0,1....| 5280|
|(19,[0,1,5,7,9,10...|    0|
|[1.0,1.0,607.0,1....| 5774|
|[1.0,1.0,502.0,1....| 4071|
|[1.0,1.0,489.0,1....| 3846|
|[1.0,1.0,540.0,1....| 4359|
|[1.0,1.0,553.0,1....| 5054|
|[1.0,2.0,589.0,1....| 6206|
|[1.0,2.0,555.0,1....| 4163|
|[1.0,2.0,535.0,1....| 4648|
|[1.0,2.0,416.0,1....| 3037|
|[1.0,2.0,514.0,1....| 4564|
|[1.0,2.0,438.0,1....| 3547|
|[1.0,2.0,546.0,1....| 5235|
|[1.0,2.0,479.0,1....| 4211|
+--------------------+-----+
only showing top 20 rows
Test the Model
Now you’re ready to use the transform method of the model to generate some predictions. You can use this approach to predict the Sales; but in this case, you are using the test data which includes a known true label value, so you can compare the Sales
%scala
val prediction = model.transform(testing)
val predicted = prediction.select("features", "prediction", "trueLabel")
predicted.show()
Output:
+--------------------+------------------+---------+
| features| prediction|trueLabel|
+--------------------+------------------+---------+
|[1.0,1.0,0.0,0.0,...| -658.167370393814| 0|
|[1.0,1.0,480.0,1....| 4500.812542169471| 3722|
|[1.0,1.0,586.0,1....| 6485.259960718802| 5518|
|[1.0,1.0,541.0,1....| 6231.062642528617| 5197|
|[1.0,1.0,526.0,1....| 4894.920001371065| 4395|
|[1.0,1.0,612.0,1....| 6753.979176910594| 6102|
|[1.0,2.0,552.0,1....| 6155.110134292569| 5199|
|[1.0,2.0,590.0,1....| 6419.264870180341| 5450|
|[1.0,2.0,503.0,1....| 5905.775911669887| 4852|
|[1.0,2.0,544.0,1....| 6192.227473786334| 5042|
|[1.0,3.0,616.0,1....|6512.7043638676405| 5809|
|[1.0,3.0,453.0,1....| 4253.148992406786| 3591|
|[1.0,3.0,476.0,1....| 5672.01404971478| 4000|
|[1.0,3.0,562.0,1....| 6212.662930021295| 5223|
|[1.0,3.0,550.0,1....| 6162.194757797231| 4767|
|[1.0,4.0,480.0,1....| 5552.846268091991| 4116|
|[1.0,4.0,471.0,1....|5542.4248828082345| 3755|
|[1.0,4.0,433.0,1....| 4086.217557420081| 3533|
|[1.0,4.0,573.0,1....| 6213.498266451294| 5558|
|[1.0,4.0,503.0,1....| 4551.70382356731| 3769|
+--------------------+------------------+---------+
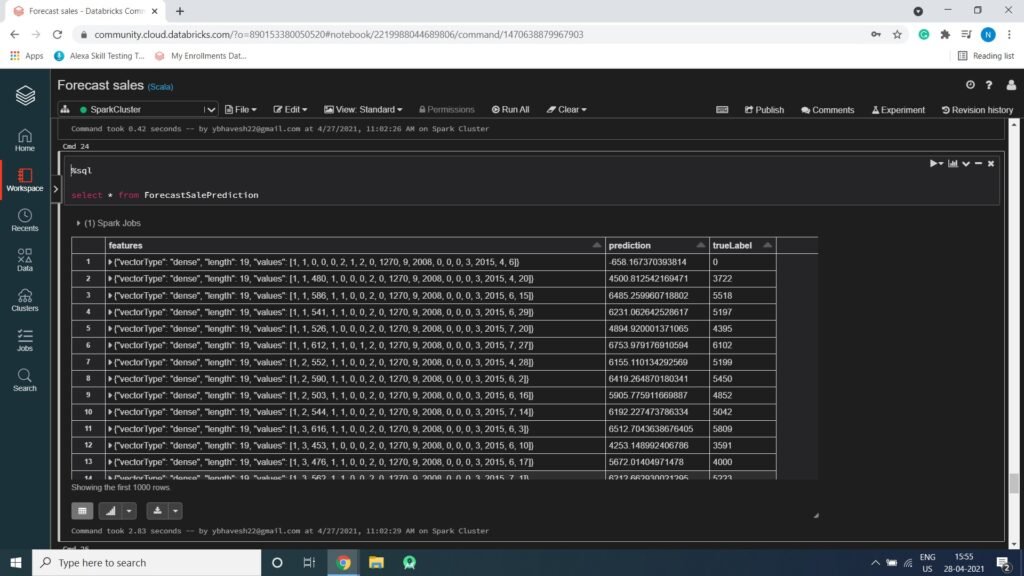
only showing top 20 rowsLooking at the result, the prediction column contains the predicted value for the label, and the trueLabel column contains the actual known value from the testing data. It looks like there is some variance between the predictions and the actual values (the individual differences are referred to as residuals) you’ll learn how to measure the accuracy of a model.
Examine the Predicted and Actual Values
You can plot the predicted values against the actual values to see how accurately the model has predicted. In a perfect model, the resulting scatter plot should form a perfect diagonal line with each predicted value being identical to the actual value – in practice, some variance is to be expected.
Run the cells below to create a temporary table from the predicted DataFrame and then retrieve the predicted and actual label values using SQL. You can then display the results as a scatter plot, specifying – as the function to show the unaggregated values.
Creating a Temp Table
%scala

predicted.createOrReplaceTempView("ForecastSalePrediction")
Performing SQL Statement
%sql

select * from ForecastSalePrediction
Plotting Scatter plot
%sql

select prediction, trueLabel from ForecastSalePrediction