This is an end-to-end Project of performing Extract-Transform-Load and Exploratory Data Analysis on a real-world dataset, and then applying several different machine learning algorithms to solve a supervised regression problem on the dataset. Our goal is to accurately predict power output given a set of environmental readings from various sensors in a natural gas-fired power generation plant.
Background
Power generation is a complex process, and understanding and predicting power output is an important element in managing a plant and its connection to the power grid. The operators of a regional power grid create predictions of power demand based on historical information and environmental factors (e.g., temperature). They then compare the predictions against available resources (e.g., coal, natural gas, nuclear, solar, wind, hydro power plants). Power generation technologies such as solar and wind are highly dependent on environmental conditions, and all generation technologies are subject to planned and unplanned maintenance.

The challenge for a power grid operator is how to handle a shortfall in available resources versus actual demand. There are three solutions to a power shortfall: build more base load power plants (this process can take many years to decades of planning and construction), buy and import power from other regional power grids (this choice can be very expensive and is limited by the power transmission interconnects between grids and the excess power available from other grids), or turn on small Peaker or Peaking Power Plants. Because grid operators need to respond quickly to a power shortfall to avoid a power outage, grid operators rely on a combination of the last two choices. In this exercise, we’ll focus on the last choice.
Problem Statement or Business Problem
Because they supply power only occasionally, the power supplied by a peaker power plant commands a much higher price per kilowatt hour than power from a power grid’s base power plants. A peaker plant may operate many hours a day, or it may operate only a few hours per year, depending on the condition of the region’s electrical grid. Because of the cost of building an efficient power plant, if a peaker plant is only going to be run for a short or highly variable time it does not make economic sense to make it as efficient as a base load power plant. In addition, the equipment and fuels used in base load plants are often unsuitable for use in peaker plants because the fluctuating conditions would severely strain the equipment.
The power output of a peaker power plant varies depending on environmental conditions, so the business problem is predicting the power output of a peaker power plant as a function of the environmental conditions — since this would enable the grid operator to make economic tradeoffs about the number of peaker plants to turn on (or whether to buy expensive power from another grid).
Given this business problem, we need to first perform Exploratory Data Analysis to understand the data and then translate the business problem (predicting power output as a function of environmental conditions) into a Machine Learning task. In this instance, the ML task is a regression since the label (or target) we are trying to predict is numeric. We will use an Apache Spark ML Pipeline to perform the regression.
The real-world data we are using in this project consists of 9,568 data points, each with 4 environmental attributes collected from a Combined Cycle Power Plant over 6 years (2006-2011).

Attribute Information or Dataset Details:
- AT = Atmospheric Temperature in C
- V = Exhaust Vacuum Speed
- AP = Atmospheric Pressure
- RH = Relative Humidity
- PE = Power Output. This is the value we are trying to predict given the measurements above.
Technology Used
- Apache Spark
- Spark SQL
- Apache Spark MLLib
- Scala
- DataFrame-based API
- Databricks Notebook
Introduction
Welcome to this project on Machine Learning Pipeline Application on Power Plant using Databricks platform community edition server which allows you to execute your spark code, free of cost on their server just by registering through email id.
In this project, we explore Apache Spark and Machine Learning on the Databricks platform.
I am a firm believer that the best way to learn is by doing. That’s why I haven’t included any purely theoretical lectures in this tutorial: you will learn everything on the way and be able to put it into practice straight away. Seeing the way each feature works will help you learn Apache Spark machine learning thoroughly by heart.
We’re going to look at how to set up a Spark Cluster and get started with that. And we’ll look at how we can then use that Spark Cluster to take data coming into that Spark Cluster, a process that data using a Machine Learning model, and generate some sort of output in the form of a prediction. That’s pretty much what we’re going to learn about the predictive model.
In this project, we will be built Machine Learning Pipeline Application on Power Plant using Regression algorithm.
We will learn:
- Preparing the Data for Processing.
- Basics flow of data in Apache Spark, loading data, and working with data, this course shows you how Apache Spark is perfect for a Machine Learning job.
- Learn the basics of Databricks notebook by enrolling in Free Community Edition Server
- Define the Machine Learning Pipeline
- Train a Machine Learning Model
- Testing a Machine Learning Model
- Evaluating a Machine Learning Model (i.e. Examine the Predicted and Actual Values)
- The goal is to provide you with practical tools that will be beneficial for you in the future. While doing that, you’ll develop a model with a real use opportunity.
I am really excited you are here, I hope you are going to follow all the way to the end of the Project. It is fairly straight forward fairly easy to follow through the article we will show you step by step each line of code & we will explain what it does and why we are doing it.
Free Account creation in Databricks
Creating a Spark Cluster
Basics about Databricks notebook
Loading Data into Databricks Environment
Download Data
Loading Data into Databricks Environment
%scala

val csv = spark.read.option("inferSchema","true").option("header", "true").csv("/FileStore/tables/Sheet4___Sheet1.csv", "/FileStore/tables/Sheet5___Sheet1.csv", "/FileStore/tables/Sheet2___Sheet1.csv", "/FileStore/tables/Sheet3___Sheet1.csv", "/FileStore/tables/Sheet1___Sheet1.csv")

csv.show()

Output:

+-----+-----+-------+-----+------+
|   AT|    V|     AP|   RH|    PE|
+-----+-----+-------+-----+------+
|23.25|71.29|1008.05|71.36|442.21|
|13.87|42.99|1007.45|81.52|471.12|
|16.91|43.96|1013.32|79.87|465.86|
|10.09|37.14|1012.99|72.59|473.66|
|12.72| 40.6|1013.45|86.16|471.23|
|17.77| 52.9|1020.11|81.51|457.98|
|24.14|63.21|1012.28|89.08|440.74|
|29.05| 75.6|1017.63|51.16|439.14|
|17.44|45.01|1013.65|75.13|456.08|
|11.17|44.77| 1018.2| 79.6|470.85|
| 8.36|38.91|1016.27|88.82|482.09|
| 16.7|36.99|1006.19|89.33| 464.7|
|15.99| 43.5|1021.34|73.22| 460.7|
|28.31|50.05|1005.75|50.17|436.75|
|28.61|52.84| 1006.0|45.73|437.39|
|10.56|40.22|1005.08|89.71|478.02|
| 12.1|44.77| 1019.1|75.85|463.11|
|33.83| 67.9|1005.94|29.86|428.12|
|21.95|59.43|1010.29|74.67|442.84|
|32.67|67.83|1007.81|42.16|425.75|
+-----+-----+-------+-----+------+
only showing top 20 rows
Print Schema
%scala

csv.printSchema()

Output:

root
 |-- AT: double (nullable = true)
 |-- V: double (nullable = true)
 |-- AP: double (nullable = true)
 |-- RH: double (nullable = true)
 |-- PE: double (nullable = true)
Statistics of Data
%scala

csv.select("AT","V","AP","RH","PE").describe().show()

Output:

+-------+------------------+------------------+------------------+------------------+-----------------+
|summary|                AT|                 V|                AP|                RH|               PE|
+-------+------------------+------------------+------------------+------------------+-----------------+
|  count|             47840|             47840|             47840|             47840|            47840|
|   mean|19.651231187290993| 54.30580372073594|1013.2590781772572| 73.30897784280918| 454.365009406355|
| stddev| 7.452161658340004|12.707361709685806| 5.938535418520816|14.599658352081477|17.06628146683769|
|    min|              1.81|             25.36|            992.89|             25.56|           420.26|
|    max|             37.11|             81.56|            1033.3|            100.16|           495.76|
+-------+------------------+------------------+------------------+------------------+-----------------+
Create Temporary View so we can perform Spark SQL on Data
%scala
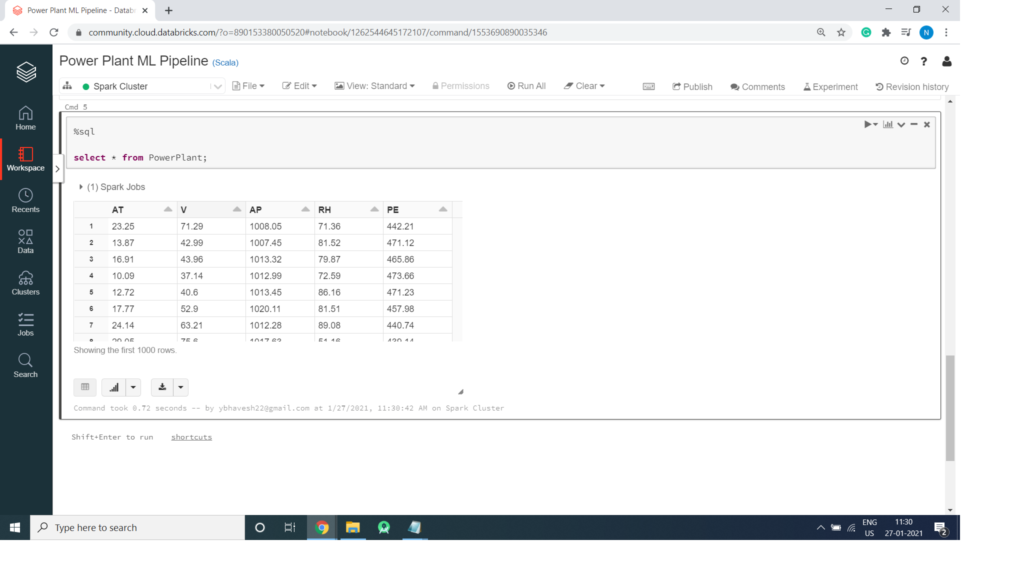
csv.createOrReplaceTempView("PowerPlant");Spark SQL
%sql

select * from PowerPlant;