Project idea – The idea behind this project is to analysis and generate Vehicle Sales Report generation and Dive into data on popular vehicles using the following dimensions such as Total Revenue, Total Products Sold, Quarterly Revenue, Total Items Sold (By Product Line), Quarterly Revenue (By Product Line), and Overall Sales (By Product Line)
Problem Statement or Business Problem
Visualizes Vehicle sales data and generate a report out of it, Dive into data on the vehicle using the following dimensions:
- Total Revenue
- Total Products Sold
- Quarterly Revenue
- Total Items Sold (By Product Line)
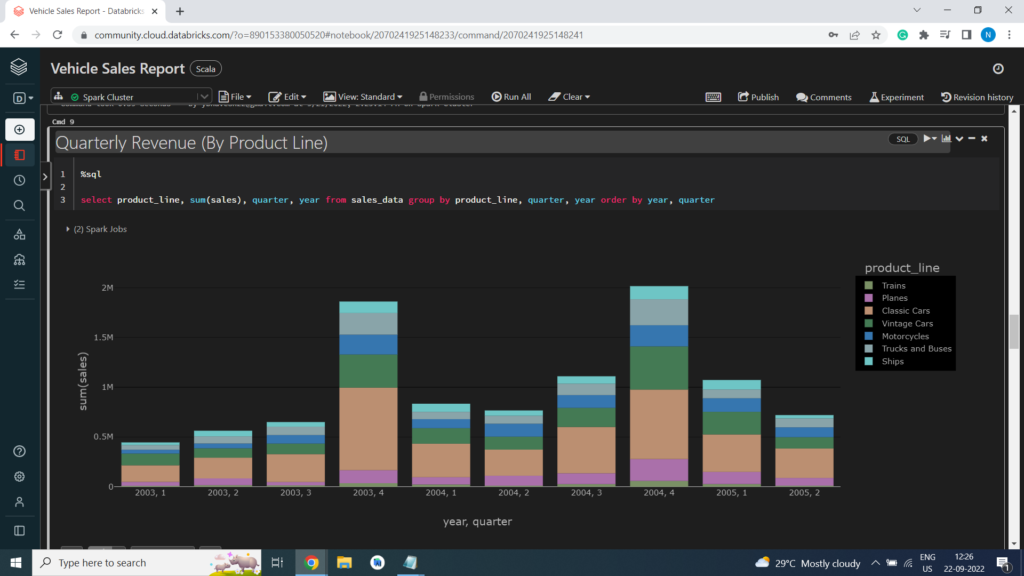
- Quarterly Revenue (By Product Line)
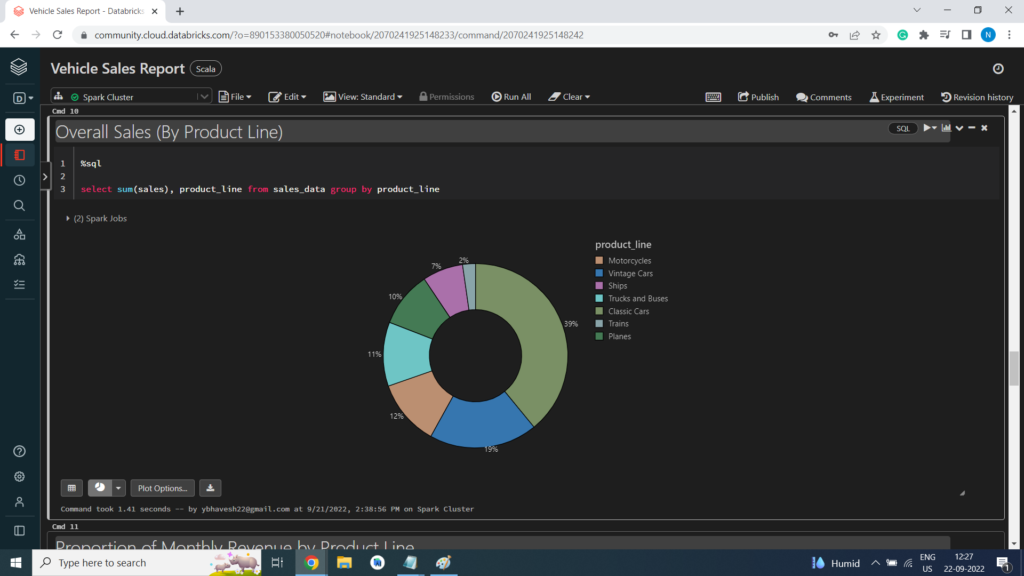
- Overall Sales (By Product Line)
- Proportion of Monthly Revenue by Product Line
- Number of Deals (for each Combination)
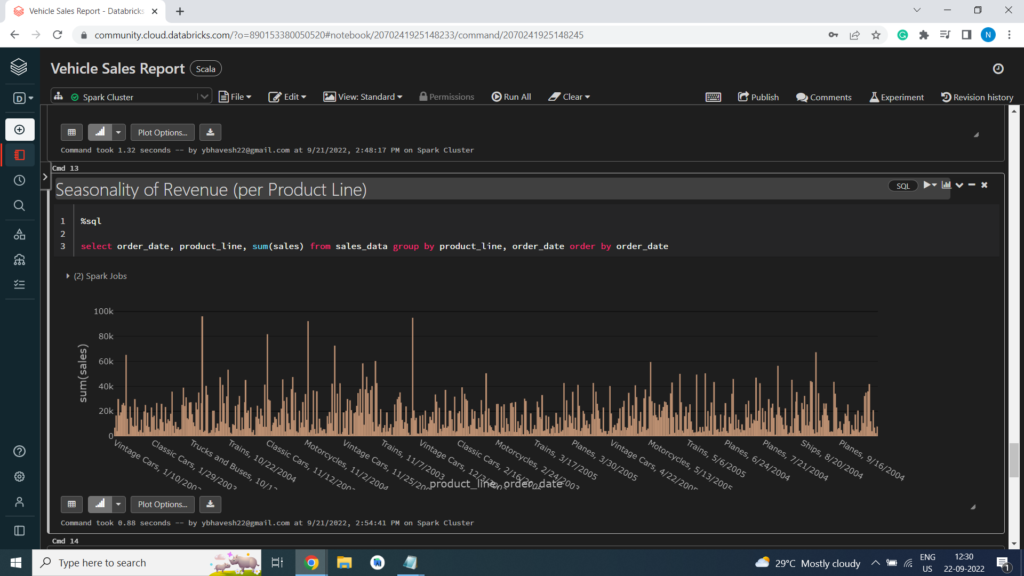
- Seasonality of Revenue (per Product Line)
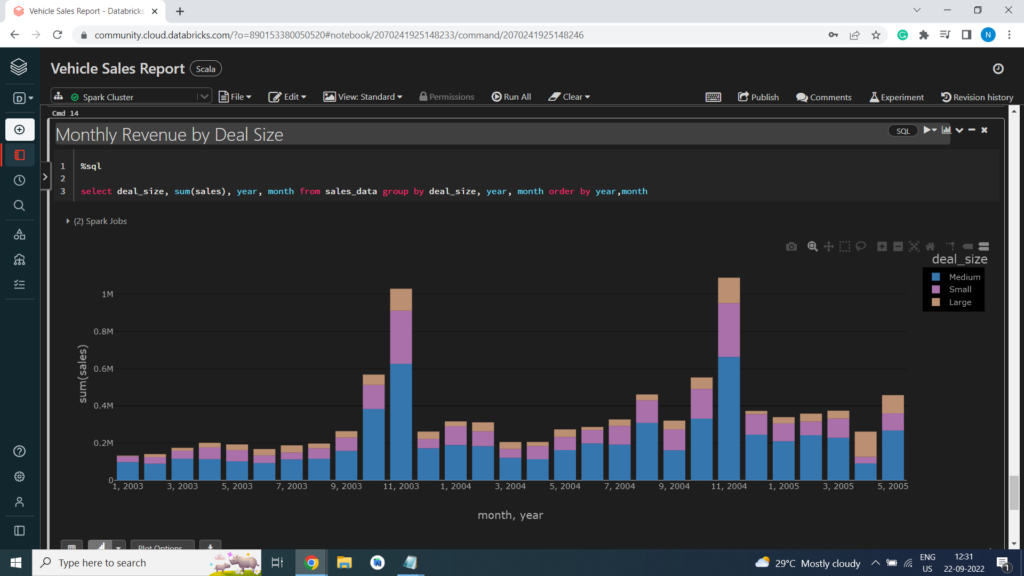
- Monthly Revenue by Deal Size
Attribute Information or Dataset Details:
- order_number: integer (nullable = true)
- quantity_ordered: integer (nullable = true)
- price_each: double (nullable = true)
- order_line_number: integer (nullable = true)
- sales: double (nullable = true)
- order_date: string (nullable = true)
- status: string (nullable = true)
- quarter: integer (nullable = true)
- month: integer (nullable = true)
- year: integer (nullable = true)
- product_line: string (nullable = true)
- msrp: integer (nullable = true)
- product_code: string (nullable = true)
- customer_name: string (nullable = true)
- phone: string (nullable = true)
- address_line1: string (nullable = true)
- address_line2: string (nullable = true)
- city: string (nullable = true)
- state: string (nullable = true)
- postal_code: string (nullable = true)
- country: string (nullable = true)
- territory: string (nullable = true)
- contact_last_name: string (nullable = true)
- contact_first_name: string (nullable = true)
- deal_size: string (nullable = true)
Technology Used
- Apache Spark
- Spark SQL
- Scala
- DataFrame-based API
- Databricks Notebook
Introduction
Welcome to this project on Vehicle Sales Report Data Analysis in Apache Spark Analytics using Databricks platform community edition server which allows you to execute your spark code, free of cost on their server just by registering through email id.
In this project, we explore Apache Spark on the Databricks platform.
I am a firm believer that the best way to learn is by doing. That’s why I haven’t included any purely theoretical lectures in this tutorial: you will learn everything on the way and be able to put it into practice straight away. Seeing the way each feature works will help you learn Apache Spark thoroughly by heart.
We’re going to look at how to set up a Spark Cluster and get started with that. And we’ll look at how we can then use that Spark Cluster to take data coming into that Spark Cluster, a process that data, and analyze the data in Databricks platform. That’s pretty much what we’re going to learn in this tutorial.
In this project, we will be performing Vehicle Sales Report Data Analysis in Apache Spark
- Preparing the Data for Processing.
- Basics flow of data in Apache Spark, loading data, and working with data, this course shows you how Apache Spark is perfect for a Data Analysis job.
- Learn the basics of Databricks notebook by enrolling in Free Community Edition Server
The goal is to provide you with practical tools that will be beneficial for you in the future. While doing that, you’ll develop a model with a real use opportunity.
I am really excited you are here, I hope you are going to follow all the way to the end of the Project. It is fairly straight forward fairly easy to follow through the article we will show you step by step each line of code & we will explain what it does and why we are doing it.
Free Account creation in Databricks
Creating a Spark Cluster
Basics about Databricks notebook
Loading Data into Databricks Environment
Download Data
Load Data in Dataframe
%scala
val sales_data = spark.read.option(“inferSchema”,”true”).option(“header”, “true”).csv(“/FileStore/tables/sales.csv”)
display(sales_data)

Print Schema of Dataframe
%scala
sales_data.printSchema()
root
|– order_number: integer (nullable = true)
|– quantity_ordered: integer (nullable = true)
|– price_each: double (nullable = true)
|– order_line_number: integer (nullable = true)
|– sales: double (nullable = true)
|– order_date: string (nullable = true)
|– status: string (nullable = true)
|– quarter: integer (nullable = true)
|– month: integer (nullable = true)
|– year: integer (nullable = true)
|– product_line: string (nullable = true)
|– msrp: integer (nullable = true)
|– product_code: string (nullable = true)
|– customer_name: string (nullable = true)
|– phone: string (nullable = true)
|– address_line1: string (nullable = true)
|– address_line2: string (nullable = true)
|– city: string (nullable = true)
|– state: string (nullable = true)
|– postal_code: string (nullable = true)
|– country: string (nullable = true)
|– territory: string (nullable = true)
|– contact_last_name: string (nullable = true)
|– contact_first_name: string (nullable = true)
|– deal_size: string (nullable = true)
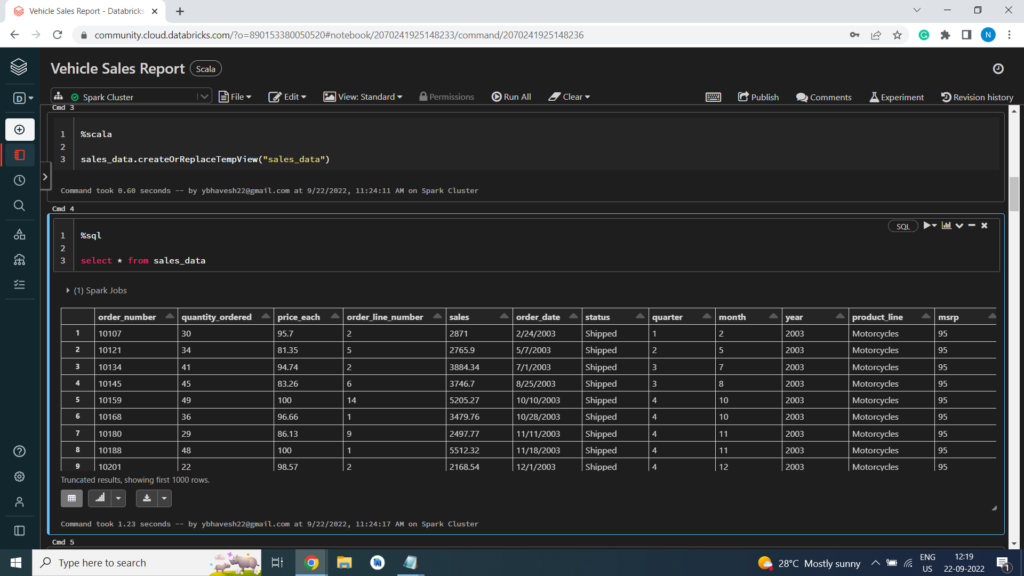
Creating Temporary View
%scala
sales_data.createOrReplaceTempView(“sales_data”)
Exploratory Data Analysis or EDA
Total Revenue
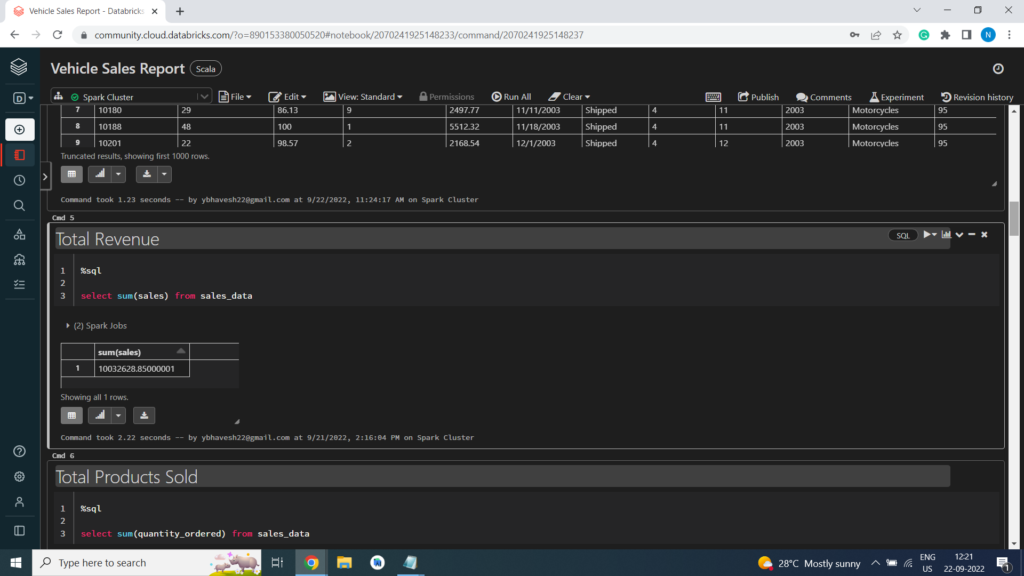
Total Products Sold

Quarterly Revenue

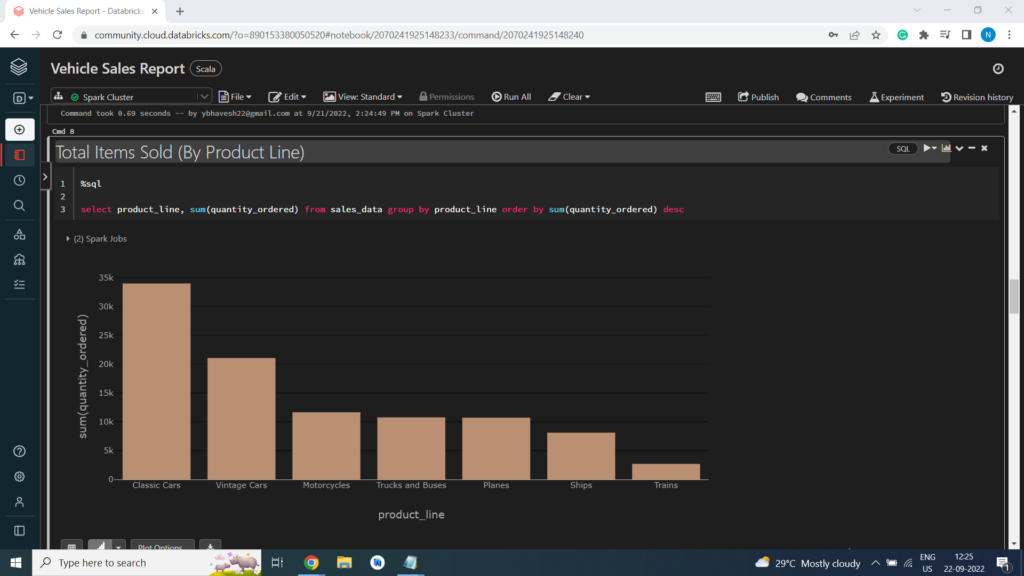
Total Items Sold (By Product Line)
Quarterly Revenue (By Product Line)
Overall Sales (By Product Line)
Proportion of Monthly Revenue by Product Line

Number of Deals (for each Combination)

Seasonality of Revenue (per Product Line)
Monthly Revenue by Deal Size