Marketing analytics consists of both qualitative and quantitative, structured and unstructured data used to drive strategic decisions in relation to brand and revenue outcomes.
Overall goal
You’re a marketing analyst and you’ve been told by the Chief Marketing Officer that recent marketing campaigns have not been as effective as they were expected to be. You need to analyze the data set to understand this problem and propose data-driven solutions.
Section 01: Exploratory Data Analysis
- Are there any null values or outliers? How will you wrangle/handle them?
- Are there any variables that warrant transformations?
- Are there any useful variables that you can engineer with the given data?
- Do you notice any patterns or anomalies in the data? Can you plot them?
Section 02: Statistical Analysis
Please run statistical tests to answer these questions & propose data-driven action recommendations to your CMO. Make sure to interpret your results with non-statistical jargon so your CMO can understand your findings.
- What factors are significantly related to the number of store purchases?
- Does US fare significantly better than the Rest of the World in terms of total purchases?
- Your supervisor insists that people who buy gold are more conservative. Therefore, people who spent an above average amount on gold in the last 2 years would have more in store purchases. Justify or refute this statement using an appropriate statistical test
- Is there a significant relationship between geographical regional and success of a campaign?
Section 03: Data Visualization
Please plot and visualize the answers to the below questions.
- Which marketing campaign is most successful?
- What does the average customer look like for this company?
- Which products are performing best?
- Which channels are underperforming?
Load Source Data
- Customer profiles
- Products purchased
- Campaign success (or failure)
- Channel performance
Data Level Details
- ID – Customer’s unique identifier
- Year_Birth – Customer’s birth year
- Education – Customer’s education level
- Marital_Status – Customer’s marital status
- Income – Customer’s yearly household income
- Kidhome – Number of children in customer’s household
- Teenhome – Number of teenagers in customer’s household
- Dt_Customer – Date of customer’s enrollment with the company
- Recency – Number of days since customer’s last purchase
- MntWines – Amount spent on wine in the last 2 years
- MntFruits – Amount spent on fruits in the last 2 years
- MntMeatProducts – Amount spent on meat in the last 2 years
- MntFishProducts – Amount spent on fish in the last 2 years
- MntSweetProducts – Amount spent on sweets in the last 2 years
- MntGoldProds – Amount spent on gold in the last 2 years
- NumDealsPurchases – Number of purchases made with a discount
- NumWebPurchases – Number of purchases made through the company’s web site
- NumCatalogPurchases – Number of purchases made using a catalogue
- NumStorePurchases – Number of purchases made directly in stores
- NumWebVisitsMonth – Number of visits to company’s web site in the last month
- AcceptedCmp3 – 1 if customer accepted the offer in the 3rd campaign, 0 otherwise
- AcceptedCmp4 – 1 if customer accepted the offer in the 4th campaign, 0 otherwise
- AcceptedCmp5 – 1 if customer accepted the offer in the 5th campaign, 0 otherwise
- AcceptedCmp1 – 1 if customer accepted the offer in the 1st campaign, 0 otherwise
- AcceptedCmp2 – 1 if customer accepted the offer in the 2nd campaign, 0 otherwise
- Response – 1 if customer accepted the offer in the last campaign, 0 otherwise
- Complain – 1 if customer complained in the last 2 years, 0 otherwise
- Country – Customer’s location
Technology Used
- Apache Spark
- Spark SQL
- Apache Spark MLLib
- Scala
- DataFrame-based API
- Databricks Notebook
Introduction
Welcome to this project on creating Marketing Analytics Report using Apache Spark on Databricks platform community edition server which allows you to execute your spark code, free of cost on their server just by registering through email id.
In this project, we explore Apache Spark, Spark SQL and Graphs (Data Visualization) on the Databricks platform.
I am a firm believer that the best way to learn is by doing. That’s why I haven’t included any purely theoretical lectures in this tutorial: you will learn everything on the way and be able to put it into practice straight away. Seeing the way each feature works will help you learn Apache Spark thoroughly by heart.
We’re going to look at how to set up a Spark Cluster and get started with that. And we’ll look at how we can then use that Spark Cluster to take data coming into that Spark Cluster, a process that data using Apache Spark, and generate some sort of output in the form of a Graphs and Data Visualization. That’s pretty much what we’re going to learn about the Marketing Analytics.
In this project, we are a marketing analyst and you’ve been told by the Chief Marketing Officer that recent marketing campaigns have not been as effective as they were expected to be. You need to analyze the data set to understand this problem and propose data-driven solutions.
We will learn:
Preparing the Data for Processing.
Basics flow of data in Apache Spark, loading data, and working with data, this tutorial shows you how Apache Spark is perfect for Data Analytics job.
Learn the basics of Databricks notebook by enrolling in Free Community Edition Server
Exploratory Data Analysis
Statistical Analysis
Data Visualization
The goal is to provide you with practical tools that will be beneficial for you in the future. While doing that, you’ll develop a Analytics Report with a real use opportunity.
I am really excited you are here, I hope you are going to follow all the way to the end of the Project. It is fairly straight forward fairly easy to follow through the article we will show you step by step each line of code & we will explain what it does and why we are doing it.
Free Account creation in Databricks
Creating a Spark Cluster
Basics about Databricks notebook
Basics about Databricks notebook
Download Data
Loading Data into DataFrame
// File location and type
val file_location = "/FileStore/tables/marketing_data.csv"
val file_type = "csv"
// CSV options
val infer_schema = "true"
val first_row_is_header = "true"
val delimiter = ","
// The applied options are for CSV files. For other file types, these will be ignored.
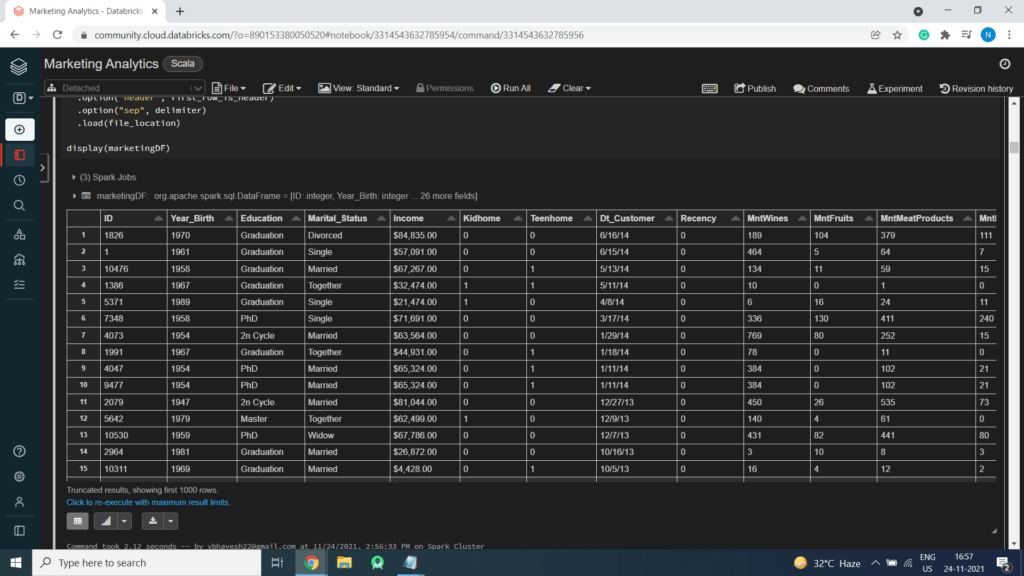
val marketingDF = spark.read.format(file_type)
.option("inferSchema", infer_schema)
.option("header", first_row_is_header)
.option("sep", delimiter)
.load(file_location)
display(marketingDF)
Count of Data (Total Records)
marketingDF.count()
res2: Long = 2240
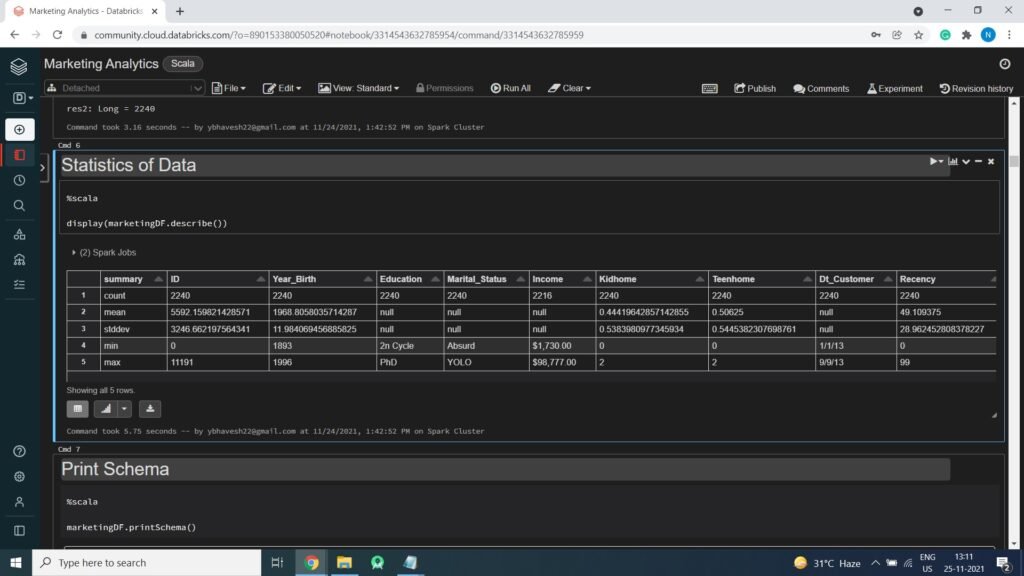
Displaying Statistics of Data
display(marketingDF.describe())
Print Schema of Data
marketingDF.printSchema()
root
|-- ID: integer (nullable = true)
|-- Year_Birth: integer (nullable = true)
|-- Education: string (nullable = true)
|-- Marital_Status: string (nullable = true)
|-- Income : string (nullable = true)
|-- Kidhome: integer (nullable = true)
|-- Teenhome: integer (nullable = true)
|-- Dt_Customer: string (nullable = true)
|-- Recency: integer (nullable = true)
|-- MntWines: integer (nullable = true)
|-- MntFruits: integer (nullable = true)
|-- MntMeatProducts: integer (nullable = true)
|-- MntFishProducts: integer (nullable = true)
|-- MntSweetProducts: integer (nullable = true)
|-- MntGoldProds: integer (nullable = true)
|-- NumDealsPurchases: integer (nullable = true)
|-- NumWebPurchases: integer (nullable = true)
|-- NumCatalogPurchases: integer (nullable = true)
|-- NumStorePurchases: integer (nullable = true)
|-- NumWebVisitsMonth: integer (nullable = true)
|-- AcceptedCmp3: integer (nullable = true)
|-- AcceptedCmp4: integer (nullable = true)
|-- AcceptedCmp5: integer (nullable = true)
|-- AcceptedCmp1: integer (nullable = true)
|-- AcceptedCmp2: integer (nullable = true)
|-- Response: integer (nullable = true)
|-- Complain: integer (nullable = true)
|-- Country: string (nullable = true)
Remove Spaces from Income Column Name (i.e. Rename a Column)
val marketingdataDF = marketingDF.withColumnRenamed(" Income ", "Income")
Print Schema
marketingdataDF.printSchema();
Output:
root
|-- ID: integer (nullable = true)
|-- Year_Birth: integer (nullable = true)
|-- Education: string (nullable = true)
|-- Marital_Status: string (nullable = true)
|-- Income: string (nullable = true)
|-- Kidhome: integer (nullable = true)
|-- Teenhome: integer (nullable = true)
|-- Dt_Customer: string (nullable = true)
|-- Recency: integer (nullable = true)
|-- MntWines: integer (nullable = true)
|-- MntFruits: integer (nullable = true)
|-- MntMeatProducts: integer (nullable = true)
|-- MntFishProducts: integer (nullable = true)
|-- MntSweetProducts: integer (nullable = true)
|-- MntGoldProds: integer (nullable = true)
|-- NumDealsPurchases: integer (nullable = true)
|-- NumWebPurchases: integer (nullable = true)
|-- NumCatalogPurchases: integer (nullable = true)
|-- NumStorePurchases: integer (nullable = true)
|-- NumWebVisitsMonth: integer (nullable = true)
|-- AcceptedCmp3: integer (nullable = true)
|-- AcceptedCmp4: integer (nullable = true)
|-- AcceptedCmp5: integer (nullable = true)
|-- AcceptedCmp1: integer (nullable = true)
|-- AcceptedCmp2: integer (nullable = true)
|-- Response: integer (nullable = true)
|-- Complain: integer (nullable = true)
|-- Country: string (nullable = true)
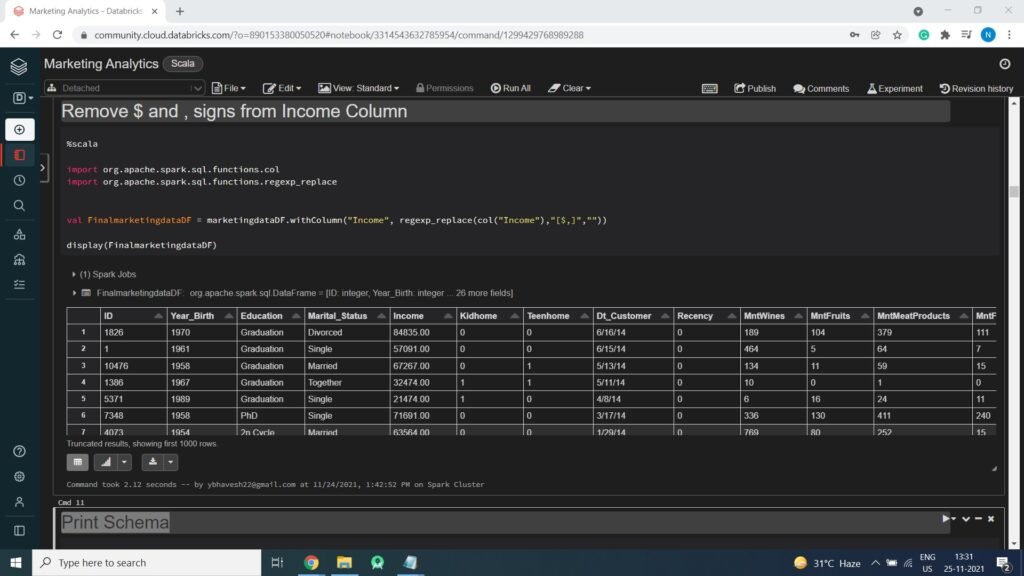
Remove $ and , signs from Income Column Values
import org.apache.spark.sql.functions.col
import org.apache.spark.sql.functions.regexp_replace
val FinalmarketingdataDF = marketingdataDF.withColumn("Income", regexp_replace(col("Income"),"[$,]",""))
display(FinalmarketingdataDF)
Converting Income column (String Type) to (Double Type)
import org.apache.spark.sql.functions.col
import org.apache.spark.sql.types.DoubleType
val Finalmarketingdataframe = FinalmarketingdataDF.withColumn("Income",col("Income").cast(DoubleType))
Print Schema
Finalmarketingdataframe.printSchema()
Output:
root
|-- ID: integer (nullable = true)
|-- Year_Birth: integer (nullable = true)
|-- Education: string (nullable = true)
|-- Marital_Status: string (nullable = true)
|-- Income: double (nullable = true)
|-- Kidhome: integer (nullable = true)
|-- Teenhome: integer (nullable = true)
|-- Dt_Customer: string (nullable = true)
|-- Recency: integer (nullable = true)
|-- MntWines: integer (nullable = true)
|-- MntFruits: integer (nullable = true)
|-- MntMeatProducts: integer (nullable = true)
|-- MntFishProducts: integer (nullable = true)
|-- MntSweetProducts: integer (nullable = true)
|-- MntGoldProds: integer (nullable = true)
|-- NumDealsPurchases: integer (nullable = true)
|-- NumWebPurchases: integer (nullable = true)
|-- NumCatalogPurchases: integer (nullable = true)
|-- NumStorePurchases: integer (nullable = true)
|-- NumWebVisitsMonth: integer (nullable = true)
|-- AcceptedCmp3: integer (nullable = true)
|-- AcceptedCmp4: integer (nullable = true)
|-- AcceptedCmp5: integer (nullable = true)
|-- AcceptedCmp1: integer (nullable = true)
|-- AcceptedCmp2: integer (nullable = true)
|-- Response: integer (nullable = true)
|-- Complain: integer (nullable = true)
|-- Country: string (nullable = true)
Display Data

Creating Temp View so we can run Spark SQL Queries on data
Finalmarketingdataframe.createOrReplaceTempView("MarketingData");
Exploratory Data Analysis
Income Distribution

Box Plot for Income

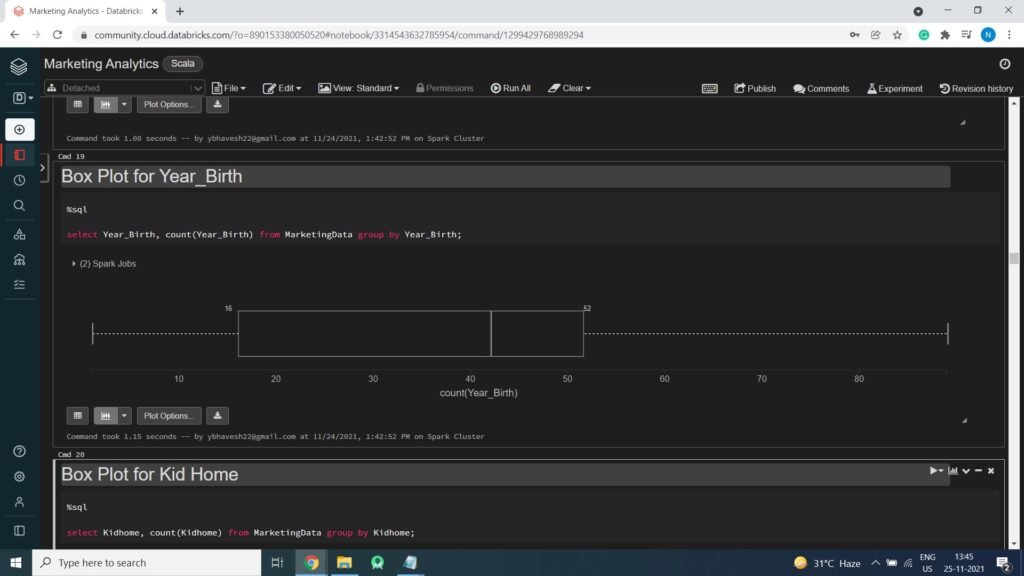
Box Plot for Year Birth
Box Plot for Kid Home

Box Plot for Teen Home

Displaying Data