

Execution of the Shell script

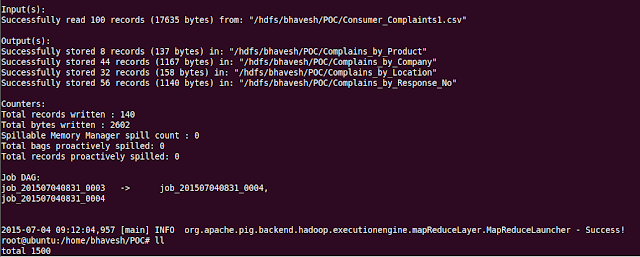

Output
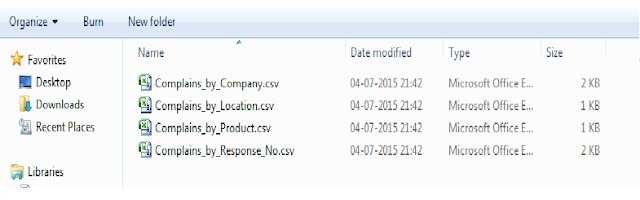
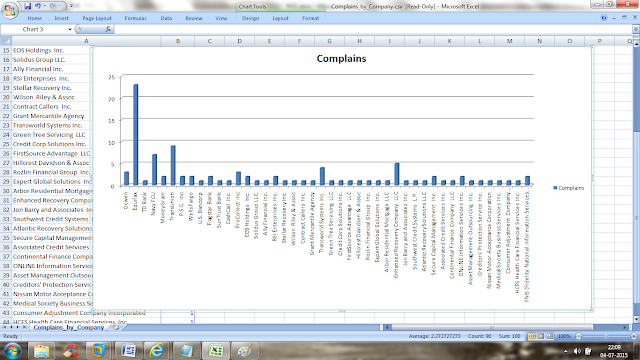
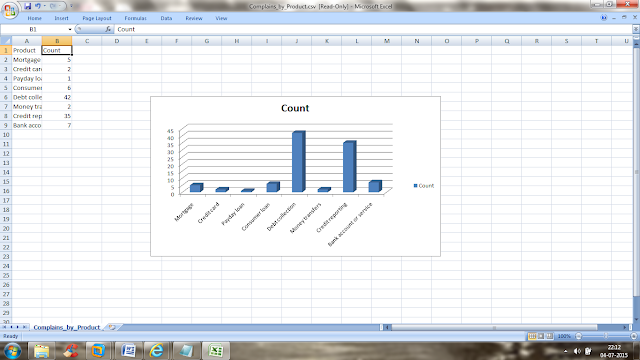
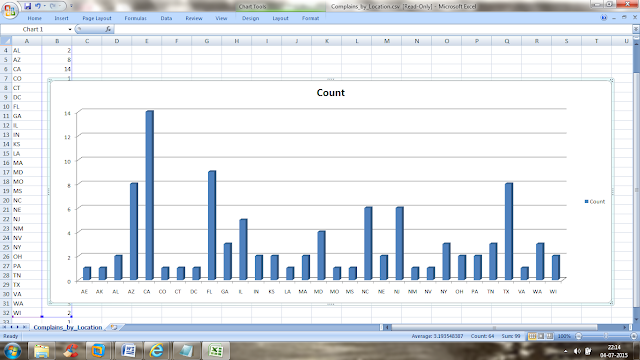
Chart view in Excel
1. Get the number of complaints filed for each company. (Complains_by_Company.csv)
2. Get the number of complaints filed under each product. (Complains_by_Product.csv)
3. Get the total number of complaints filed from a particular location (Complains_by_Location.csv)
4. Get the list of company grouped by location which has no timely response (Complains_by_Response_No.csv)

(Note: To generate the below Chart we need to Use PIVOT Chart option in Order to group data)