
In today’s digital world, every click matters. Understanding how users interact with your website in real time can provide invaluable insights — from improving UX to boosting conversions. In this hands-on project, we’ll simulate, process, and visualize user behavior using a full-stack big data pipeline.
🚀 Project Overview
In this project, we build an end-to-end clickstream analytics system using:
Java to simulate user behavior
Apache Kafka for real-time event streaming
Apache Spark Structured Streaming (Scala) to process and transform data
MySQL to store structured results
Apache Zeppelin to build interactive dashboards
🔄 Architecture Diagram
[Java Clickstream Generator] → [Apache Kafka] → [Spark Streaming (Scala)] → [MySQL] ← [Apache Zeppelin]
🔧 Components & Workflow
1️⃣ Java Clickstream Data Generator
We simulate 200+ user sessions with the following attributes:
user_id,session_id,timestampNavigation paths (
url_visited,referrer_url,click_path)Interactions (
button_clicks,form_submissions)Conversion data (
transactions,signups)Technical metrics (
page_load_time_ms,scroll_depth_pct)Session lifecycle (
session_start_time,session_end_time,exit_page)
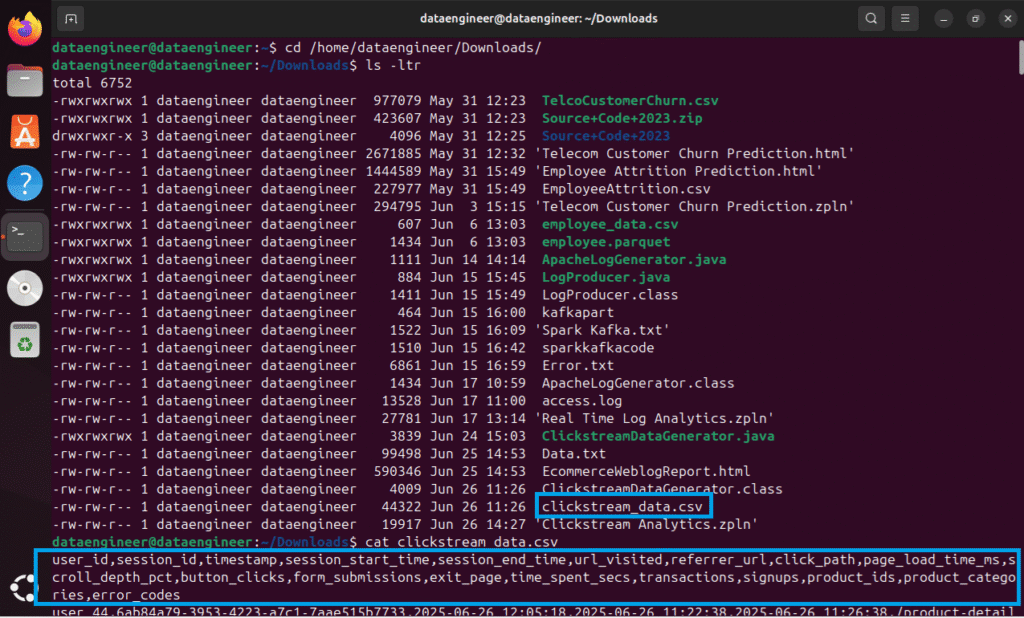
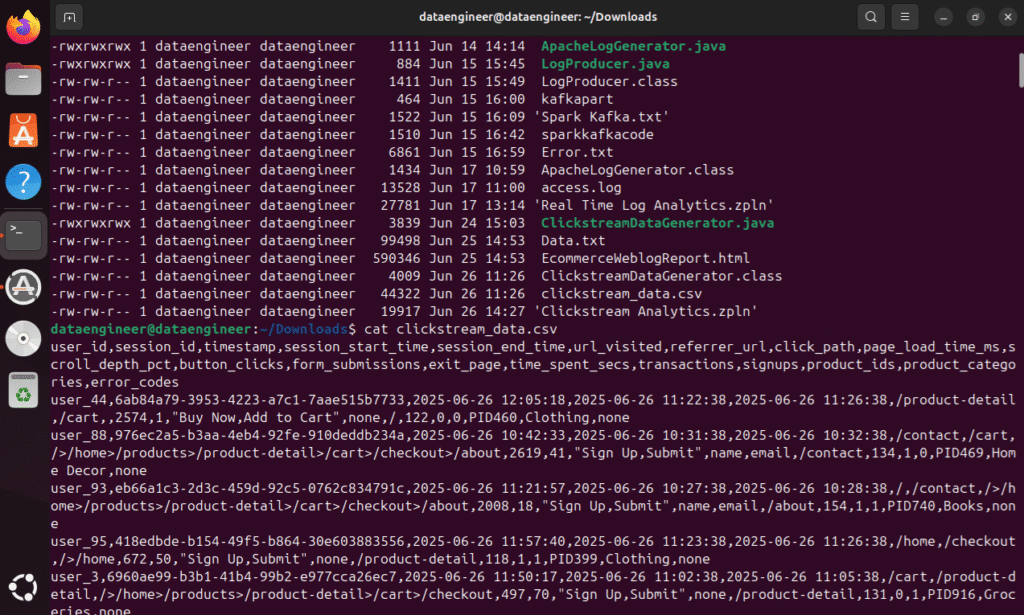
This data is written to a CSV and published to Kafka in real time.
Data Level Details
Clickstream Data Columns:
User Identification:
User ID: A unique identifier for the user.
Session ID: A unique identifier for a specific browsing session.
Navigation & Actions:
URL Visited: The specific web page the user accessed.
Referrer URL: The URL of the page the user was on before visiting the current page.
Click Path: The sequence of clicks or actions taken by the user.
Page Load Time: The time it takes for a page to load.
Scroll Depth: How far down the page a user scrolled.
Button Clicks: Which buttons or interactive elements the user clicked.
Form Submissions: Whether a form was submitted and which fields were filled.
Exit Page: The page a user leaves the website from.
Time Spent on Page: How long the user was on a particular page.
Temporal Data:
Timestamp: The specific date and time an event occurred.
Session Start Time: When the user’s browsing session began.
Session End Time: When the user’s browsing session ended.
Conversion & Other Data:
Transactions: Records of purchases or other transactions.
Signups: Records of new user registrations.
Product IDs: If applicable, the IDs of products viewed or added to a cart.
Product Categories: The categories of products viewed or added to a cart.
Error Codes: Information about any errors encountered
2️⃣ Apache Kafka: Real-Time Streaming Layer
Kafka ingests each clickstream line as a message under the topic clickstreamdata.
Kafka acts as the reliable transport mechanism between the generator and processor.
Sending Data to Kafka Topic
bin/kafka-console-producer.sh –topic logs –bootstrap-server localhost:9092 < /home/dataengineer/Downloads/access.log
3️⃣ Apache Spark Structured Streaming (Scala)
Spark reads, parses, and processes Kafka messages:
Converts each line into structured columns
Cleans header rows and malformed records
Casts types (e.g., time spent, load time) appropriately
Parses
timestampintoevent_timestampWrites the cleaned stream as Parquet files for durability
Spark Streaming
%spark
import org.apache.spark.sql.types._
import org.apache.spark.sql.functions._
import spark.implicits._
// Step 1: Read data from Kafka
val kafkaStream = spark.readStream
.format(“kafka”)
.option(“kafka.bootstrap.servers”, “localhost:9092”)
.option(“subscribe”, “clickstreamdata”)
.option(“startingOffsets”, “earliest”)
.load()
val columnNames = Array(
“user_id”, “session_id”, “timestamp”, “session_start_time”, “session_end_time”,
“url_visited”, “referrer_url”, “click_path”, “page_load_time_ms”, “scroll_depth_pct”,
“button_clicks”, “form_submissions”, “exit_page”, “time_spent_secs”,
“transactions”, “signups”, “product_ids”, “product_categories”, “error_codes”
)
val parsedStream = kafkaStream
.selectExpr(“CAST(value AS STRING) as csv_value”)
.withColumn(“csv_array”, split(col(“csv_value”), “,(?=(?:[^\”]*\”[^\”]*\”)*[^\”]*$)”))
.filter(size(col(“csv_array”)) === columnNames.length)
// Apply schema to split columns
val structuredStream = columnNames.zipWithIndex.foldLeft(parsedStream) {
case (df, (colName, idx)) => df.withColumn(colName, trim(col(“csv_array”).getItem(idx)))
}.drop(“csv_array”, “csv_value”)
// Optional: Cast specific columns to correct data types
val filteredStream = structuredStream.filter($”user_id” =!= “user_id”)
val finalStream = filteredStream
.withColumn(“page_load_time_ms”, col(“page_load_time_ms”).cast(“int”))
.withColumn(“scroll_depth_pct”, col(“scroll_depth_pct”).cast(“int”))
.withColumn(“time_spent_secs”, col(“time_spent_secs”).cast(“int”))
.withColumn(“transactions”, col(“transactions”).cast(“int”))
.withColumn(“signups”, col(“signups”).cast(“int”))
.withColumn(“event_timestamp”, to_timestamp(col(“timestamp”), “yyyy-MM-dd HH:mm:ss”))
// Optional: You can add filters or transformations here if needed
// Step 4: Write to Parquet sink
val parquetOutputPath = “/home/dataengineer/clickstream/parquetoutput”
val checkpointPath = “/home/dataengineer/clickstream/checkpnt”
finalStream.writeStream
.format(“parquet”)
.option(“path”, parquetOutputPath)
.option(“checkpointLocation”, checkpointPath)
.outputMode(“append”)
.start()
Spark Core
%spark
val parquetDF = spark.read.parquet(“/home/dataengineer/clickstream/parquetoutput/”)
val jdbcUrl = “jdbc:mysql://localhost:3306/logsdb” // Replace with your DB details
val dbTable = “clickstream_data” // Replace with your target table name
val dbUser = “root” // Replace with your MySQL username
val dbPassword = “password” // Replace with your MySQL password
// Save DataFrame to MySQL
parquetDF.write
.format(“jdbc”)
.option(“url”, jdbcUrl)
.option(“dbtable”, dbTable)
.option(“user”, dbUser)
.option(“password”, dbPassword)
.option(“driver”, “com.mysql.cj.jdbc.Driver”) // Use com.mysql.jdbc.Driver for older versions
.mode(“append”) // use “overwrite” to replace existing data
.save()
4️⃣ MySQL: Persistent Storage Layer
Parquet files are batch loaded into MySQL using JDBC. This makes the data easy to explore with BI tools like Apache Zeppelin.
CREATE TABLE clickstream_data (
user_id VARCHAR(50),
session_id VARCHAR(100),
timestamp DATETIME,
session_start_time DATETIME,
session_end_time DATETIME,
url_visited VARCHAR(255),
referrer_url VARCHAR(255),
click_path TEXT,
page_load_time_ms INT,
scroll_depth_pct INT,
button_clicks TEXT,
form_submissions TEXT,
exit_page VARCHAR(255),
time_spent_secs INT,
transactions INT,
signups INT,
product_ids VARCHAR(100),
product_categories VARCHAR(100),
error_codes VARCHAR(50),
event_timestamp DATETIME
);
5️⃣ Apache Zeppelin: Clickstream Dashboard
Zeppelin queries MySQL and builds visual dashboards like:
🔹 Daily Sessions
SELECT DATE(event_timestamp), COUNT(DISTINCT session_id) FROM clickstream_data GROUP BY 1;
🔹 Session Duration Distribution
SELECT session_id, TIMESTAMPDIFF(SECOND, session_start_time, session_end_time) AS duration FROM clickstream_data;
🔹 Top Landing & Exit Pages
🔹 Common Click Paths & Button Clicks
SELECT click_path, COUNT(*) FROM clickstream_data GROUP BY click_path ORDER BY 2 DESC LIMIT 10;
📊 Why Clickstream Analysis?
Clickstream data enables teams to:
Identify top content and traffic sources
Understand drop-off points in user journeys
Optimize user experience with session and scroll analysis
Detect anomalies and errors in site performance
Drive personalization with real-time insights
🎯 Skills You’ll Gain
✅ Apache Kafka (Streaming Ingestion)
✅ Spark Structured Streaming with Scala
✅ Working with Parquet and JDBC
✅ Real-time ETL and transformation pipelines
✅ BI dashboards with Zeppelin and SQL
📢 Conclusion
This project is a great foundation to build advanced real-time analytics solutions. Whether you’re preparing for a data engineering role or upgrading your streaming skills, mastering this pipeline helps you design systems that scale.