Since as a beginner in machine learning it would be a great opportunity to try some techniques to predict the outcome of the drugs that might be accurate for the patient.

Problem Statement or Business Problem
The target feature is
- Drug type
The feature sets are:
- Age
- Sex
- Blood Pressure Levels (BP)
- Cholesterol Levels
- Na to Potassium Ration
The main problem here is not just the feature sets and target sets but also the approach that is taken in solving these types of problems as a beginner. So best of luck.
Attribute Information or Dataset Details:
- Age
- Sex
- BP
- Cholesterol
- Na_to_K
- Drug

Technology Used
- Apache Spark
- Spark SQL
- Apache Spark MLLib
- Scala
- DataFrame-based API
- Databricks Notebook
Introduction
Welcome to this project on Drug Classification in Apache Spark Machine Learning using Databricks platform community edition server which allows you to execute your spark code, free of cost on their server just by registering through email id.
In this project, we explore Apache Spark and Machine Learning on the Databricks platform.
I am a firm believer that the best way to learn is by doing. That’s why I haven’t included any purely theoretical lectures in this tutorial: you will learn everything on the way and be able to put it into practice straight away. Seeing the way each feature works will help you learn Apache Spark machine learning thoroughly by heart.
We’re going to look at how to set up a Spark Cluster and get started with that. And we’ll look at how we can then use that Spark Cluster to take data coming into that Spark Cluster, a process that data using a Machine Learning model, and generate some sort of output in the form of a prediction. That’s pretty much what we’re going to learn about the predictive model.
In this project, we will be performing Drug Classification using a Logistic Regression algorithm.
We will learn:
- Preparing the Data for Processing.
- Basics flow of data in Apache Spark, loading data, and working with data, this course shows you how Apache Spark is perfect for a Machine Learning job.
- Learn the basics of Databricks notebook by enrolling in Free Community Edition Server
- Define the Machine Learning Pipeline
- Train a Machine Learning Model
- Testing a Machine Learning Model
- Evaluating a Machine Learning Model (i.e. Examine the Predicted and Actual Values)
The goal is to provide you with practical tools that will be beneficial for you in the future. While doing that, you’ll develop a model with a real use opportunity.
I am really excited you are here, I hope you are going to follow all the way to the end of the Project. It is fairly straight forward fairly easy to follow through the article we will show you step by step each line of code & we will explain what it does and why we are doing it.
Free Account creation in Databricks
Creating a Spark Cluster
Basics about Databricks notebook
Loading Data into Databricks Environment
Download Data
Load Data in Dataframe
%scala

val csv = spark.read.option("inferSchema","true").option("header", "true").csv("/FileStore/tables/drug200.csv")

csv.show()

Output:

+---+---+------+-----------+-------+-----+
|Age|Sex|    BP|Cholesterol|Na_to_K| Drug|
+---+---+------+-----------+-------+-----+
| 23|  F|  HIGH|       HIGH| 25.355|DrugY|
| 47|  M|   LOW|       HIGH| 13.093|drugC|
| 47|  M|   LOW|       HIGH| 10.114|drugC|
| 28|  F|NORMAL|       HIGH|  7.798|drugX|
| 61|  F|   LOW|       HIGH| 18.043|DrugY|
| 22|  F|NORMAL|       HIGH|  8.607|drugX|
| 49|  F|NORMAL|       HIGH| 16.275|DrugY|
| 41|  M|   LOW|       HIGH| 11.037|drugC|
| 60|  M|NORMAL|       HIGH| 15.171|DrugY|
| 43|  M|   LOW|     NORMAL| 19.368|DrugY|
| 47|  F|   LOW|       HIGH| 11.767|drugC|
| 34|  F|  HIGH|     NORMAL| 19.199|DrugY|
| 43|  M|   LOW|       HIGH| 15.376|DrugY|
| 74|  F|   LOW|       HIGH| 20.942|DrugY|
| 50|  F|NORMAL|       HIGH| 12.703|drugX|
| 16|  F|  HIGH|     NORMAL| 15.516|DrugY|
| 69|  M|   LOW|     NORMAL| 11.455|drugX|
| 43|  M|  HIGH|       HIGH| 13.972|drugA|
| 23|  M|   LOW|       HIGH|  7.298|drugC|
| 32|  F|  HIGH|     NORMAL| 25.974|DrugY|
+---+---+------+-----------+-------+-----+
only showing top 20 rows
Printing Schema of Dataframe
%scala

csv.printSchema()

Output:

root
 |-- Age: integer (nullable = true)
 |-- Sex: string (nullable = true)
 |-- BP: string (nullable = true)
 |-- Cholesterol: string (nullable = true)
 |-- Na_to_K: double (nullable = true)
 |-- Drug: string (nullable = true)
Get Statistics of Data
%scala

csv.select("Age", "Sex", "BP", "Cholesterol", "Na_to_K", "Drug").describe().show()

Output:

+-------+------------------+----+------+-----------+-----------------+-----+
|summary|               Age| Sex|    BP|Cholesterol|          Na_to_K| Drug|
+-------+------------------+----+------+-----------+-----------------+-----+
|  count|               200| 200|   200|        200|              200|  200|
|   mean|            44.315|null|  null|       null|16.08448499999999| null|
| stddev|16.544314634751974|null|  null|       null|7.223955528459517| null|
|    min|                15|   F|  HIGH|       HIGH|            6.269|DrugY|
|    max|                74|   M|NORMAL|     NORMAL|           38.247|drugX|
+-------+------------------+----+------+-----------+-----------------+-----+
Creating Temporary View in Spark so that we can use Spark SQL to Analyze the Data
%scala

csv.createOrReplaceTempView("DrugsData");
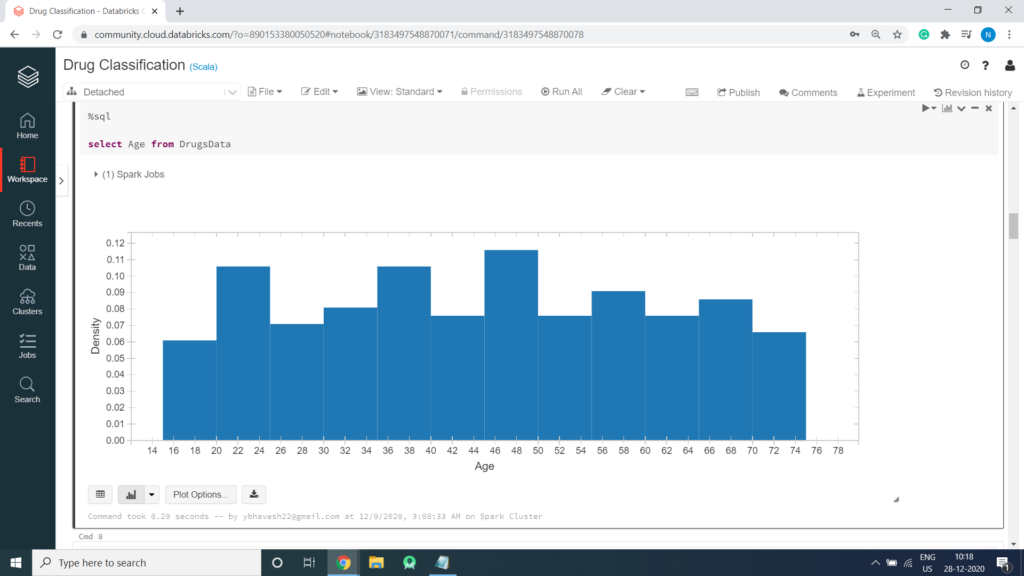
Generate Graph
%sql

select Age from DrugsData
Histogram

Collecting all String Columns into an Array
%scala

var StringfeatureCol = Array("Sex", "BP", "Cholesterol", "Drug");
StringIndexer encodes a string column of labels to a column of label indices.
Example of StringIndexer
%scala

import org.apache.spark.ml.feature.StringIndexer

val df = spark.createDataFrame(
  Seq((0, "a"), (1, "b"), (2, "c"), (3, "a"), (4, "a"), (5, "c"))
).toDF("id", "category")

df.show()

val indexer = new StringIndexer()
  .setInputCol("category")
  .setOutputCol("categoryIndex")

val indexed = indexer.fit(df).transform(df)

indexed.show()

Output:

+---+--------+
| id|category|
+---+--------+
|  0|       a|
|  1|       b|
|  2|       c|
|  3|       a|
|  4|       a|
|  5|       c|
+---+--------+

+---+--------+-------------+
| id|category|categoryIndex|
+---+--------+-------------+
|  0|       a|          0.0|
|  1|       b|          2.0|
|  2|       c|          1.0|
|  3|       a|          0.0|
|  4|       a|          0.0|
|  5|       c|          1.0|
+---+--------+-------------+
Define the Pipeline
A predictive model often requires multiple stages of feature preparation.
A pipeline consists of a series of transformer and estimator stages that typically prepare a DataFrame for modeling and then train a predictive model.
In this case, you will create a pipeline with stages:
- A StringIndexer estimator that converts string values to indexes for categorical features
- A VectorAssembler that combines categorical features into a single vector
%scala
import org.apache.spark.ml.attribute.Attribute
import org.apache.spark.ml.feature.{IndexToString, StringIndexer}
import org.apache.spark.ml.{Pipeline, PipelineModel}
val indexers = StringfeatureCol.map { colName =>
new StringIndexer().setInputCol(colName).setHandleInvalid("skip").setOutputCol(colName + "_indexed")
}
val pipeline = new Pipeline()
.setStages(indexers)
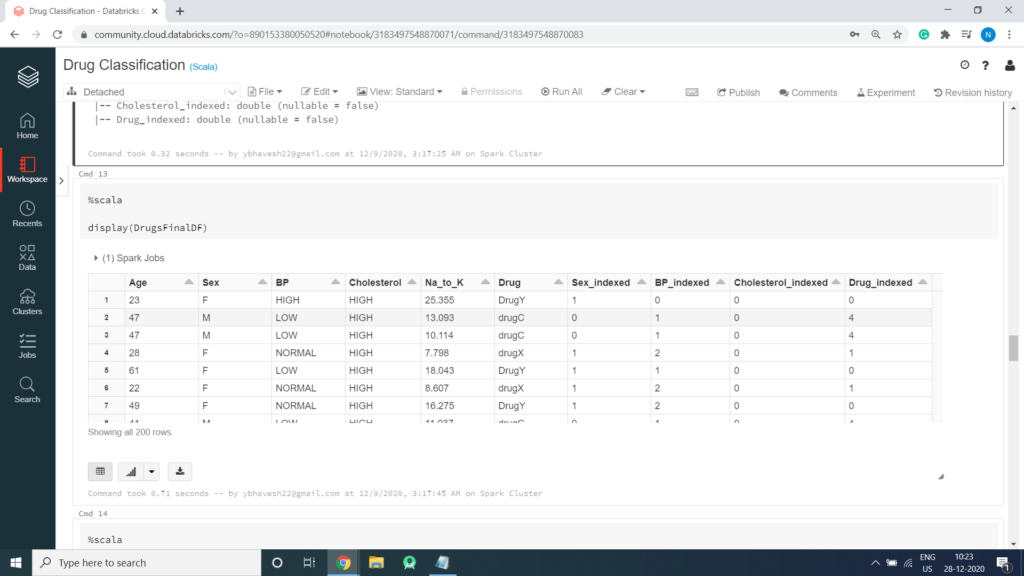
val DrugsFinalDF = pipeline.fit(csv).transform(csv)Print Schema to view String Columns are converted in to equivalent Numerical Columns
%scala

DrugsFinalDF.printSchema()

Output:

root
 |-- Age: integer (nullable = true)
 |-- Sex: string (nullable = true)
 |-- BP: string (nullable = true)
 |-- Cholesterol: string (nullable = true)
 |-- Na_to_K: double (nullable = true)
 |-- Drug: string (nullable = true)
 |-- Sex_indexed: double (nullable = false)
 |-- BP_indexed: double (nullable = false)
 |-- Cholesterol_indexed: double (nullable = false)
 |-- Drug_indexed: double (nullable = false)
Display Data