Health care analytics is the health care analysis activities that can be undertaken as a result of data collected from four areas within healthcare; claims and cost data, pharmaceutical and research and development (R&D) data, clinical data (collected from electronic medical records (EHRs)), and patient behavior and sentiment data.
Data Description
PatientProfile.csv – This file contains Patient profile details like PatientID, OnlineFollower, Social media details, Income, Education, Age, FirstInteractionDate, CityType and Employer_Category
More Info On patient_profiles file.
- Patient_ID Unique Identifier for each patient. This ID is not sequential in nature and can not be used in model
- Online_Follower Whether a patient follows MedCamp online or not
- Linkedin_Shared Whether the patient has shared details of a camp on his LinkedIn id
- Twitter_Shared Whether the patient has tweeted about the health camp
- Facebook_Shared Whether the patient has shared an update about the health camp
- Income Income of the patient
- Education_Score Score about education of the patient. Higher would mean better
- Age Age of the patient (as captured at time of registration)
- First_Interaction Date of first interaction
- City_Type Category of the city
- Employer_Category Category of the employer
FirstHealthCampAttended.csv – This file contains details about people who attended health camp of first format. This includes Donation (amount) & HealthScore of the person.
Technology Used
- Apache Spark
- Spark SQL
- Apache Spark MLLib
- Scala
- DataFrame-based API
- Databricks Notebook
Introduction
Welcome to this project on creating Healthcare Analytics Report using Apache Spark on Databricks platform community edition server which allows you to execute your spark code, free of cost on their server just by registering through email id.
In this project, we explore Apache Spark, Spark SQL and Graphs (Data Visualization) on the Databricks platform.
I am a firm believer that the best way to learn is by doing. That’s why I haven’t included any purely theoretical lectures in this tutorial: you will learn everything on the way and be able to put it into practice straight away. Seeing the way each feature works will help you learn Apache Spark thoroughly by heart.
We’re going to look at how to set up a Spark Cluster and get started with that. And we’ll look at how we can then use that Spark Cluster to take data coming into that Spark Cluster, a process that data using Apache Spark, and generate some sort of output in the form of a Graphs and Data Visualization. That’s pretty much what we’re going to learn about the Healthcare Analytics.
You need to analyze the data set to understand this problem and propose data-driven solutions.
We will learn:
Preparing the Data for Processing.
Basics flow of data in Apache Spark, loading data, and working with data, this tutorial shows you how Apache Spark is perfect for Data Analytics job.
Learn the basics of Databricks notebook by enrolling in Free Community Edition Server
Exploratory Data Analysis
Statistical Analysis
Data Visualization
The goal is to provide you with practical tools that will be beneficial for you in the future. While doing that, you’ll develop a Analytics Report with a real use opportunity.
I am really excited you are here, I hope you are going to follow all the way to the end of the Project. It is fairly straight forward fairly easy to follow through the article we will show you step by step each line of code & we will explain what it does and why we are doing it.
Free Account creation in Databricks
Creating a Spark Cluster
Creating a Spark Cluster
Basics about Databricks notebook
Basics about Databricks notebook
Basics about Databricks notebook
Download Data
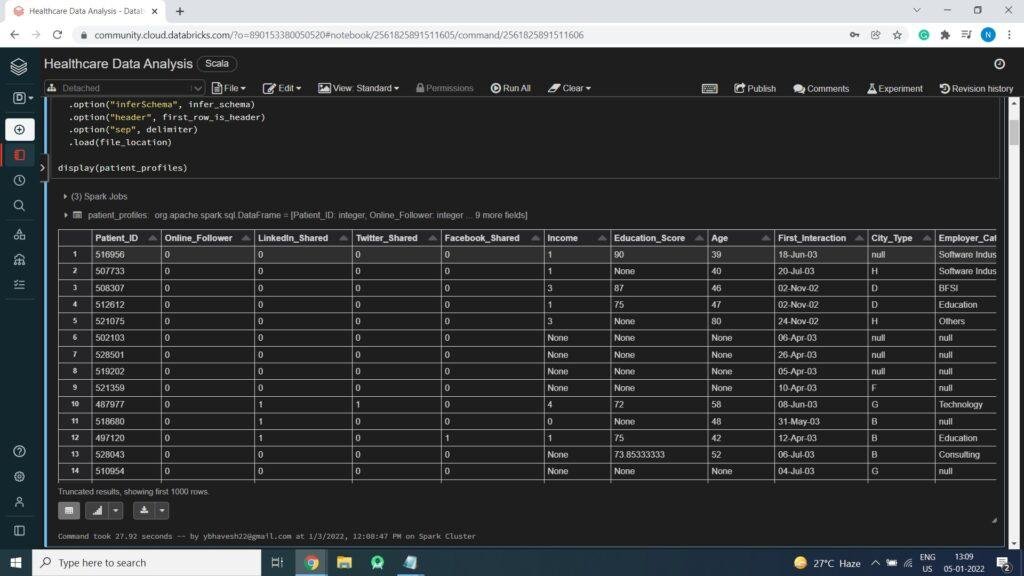
Loading Data into DataFrame
Loading Data into DataFrame
// File location and type
val file_location = "/FileStore/tables/Patient_Profile.csv"
val file_type = "csv"
// CSV options
val infer_schema = "true"
val first_row_is_header = "true"
val delimiter = ","
// The applied options are for CSV files. For other file types, these will be ignored.
val patient_profiles = spark.read.format(file_type)
.option("inferSchema", infer_schema)
.option("header", first_row_is_header)
.option("sep", delimiter)
.load(file_location)
display(patient_profiles)
Count of Data (Total Records)
Count of Data (Total Records)
patient_profiles.count()
res2: Long = 37633
Displaying Statistics of Data
display(patient_profiles.describe())

Print Schema of Data
patient_profiles.printSchema()
root
|-- Patient_ID: integer (nullable = true)
|-- Online_Follower: integer (nullable = true)
|-- LinkedIn_Shared: integer (nullable = true)
|-- Twitter_Shared: integer (nullable = true)
|-- Facebook_Shared: integer (nullable = true)
|-- Income: string (nullable = true)
|-- Education_Score: string (nullable = true)
|-- Age: string (nullable = true)
|-- First_Interaction: string (nullable = true)
|-- City_Type: string (nullable = true)
|-- Employer_Category: string (nullable = true)
Creating Temp View so we can run Spark SQL Queries on data
patient_profiles.createOrReplaceTempView("Patient_Profiles");
Exploratory Data Analysis
Age Vs Facebook

Age Vs Online Follower

Patient's Cities