In this article, We have explored the Sentiments of People in India during Demonetization. Even by using small data, I could still gain a lot of valuable insights. I have used Spark SQL and Inbuild graphs provided by Databricks.
India is the second-most populous country in the world, with over 1.271 billion people, more than a sixth of the world’s population. Let us find out the views of different people on the demonetization by analyzing the tweets from Twitter.

Attribute Information or Dataset Details:
| col_name | data_type | comment |
|---|---|---|
| retweeted | string | null |
| isRetweet | string | null |
| retweetCount | string | null |
| screenName | string | null |
| statusSource | string | null |
| replyToUID | string | null |
| id | string | null |
| replyToSID | string | null |
| truncated | string | null |
| created | string | null |
| replyToSN | string | null |
| favoriteCount | string | null |
| favorited | string | null |
| text | string | null |
| X | bigint | null |
| _c0 | bigint | null |
Table Created in Databricks Environment


Technology Used
- Apache Spark
- Spark SQL
- DataFrame-based API
- Databricks Notebook
Free Account creation in Databricks
Creating a Spark Cluster
Basics about Databricks notebook
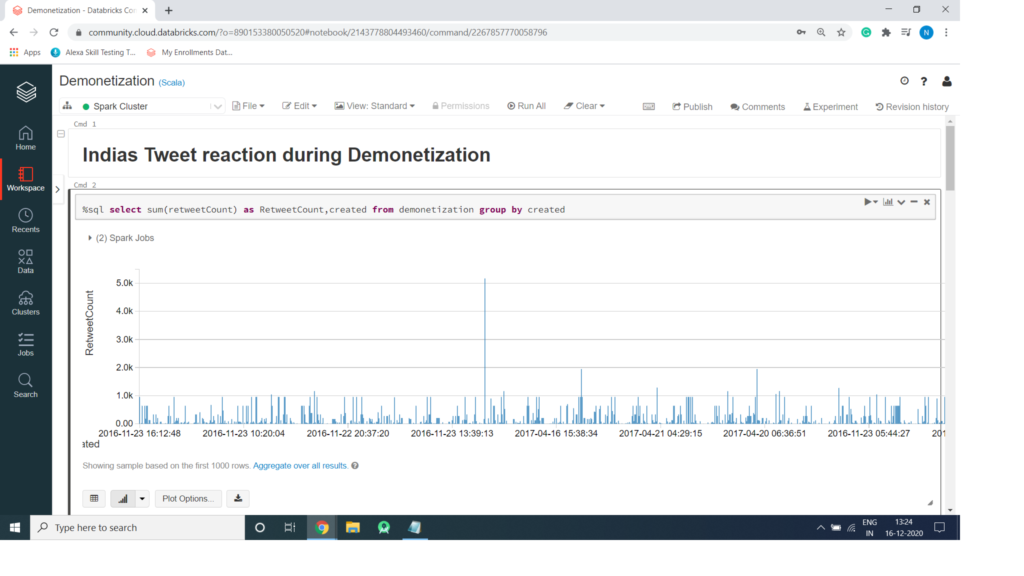
Code for Spark SQL to get Indias Tweet reaction during Demonetization
%sql

select sum(retweetCount) as RetweetCount,created from demonetization group by created
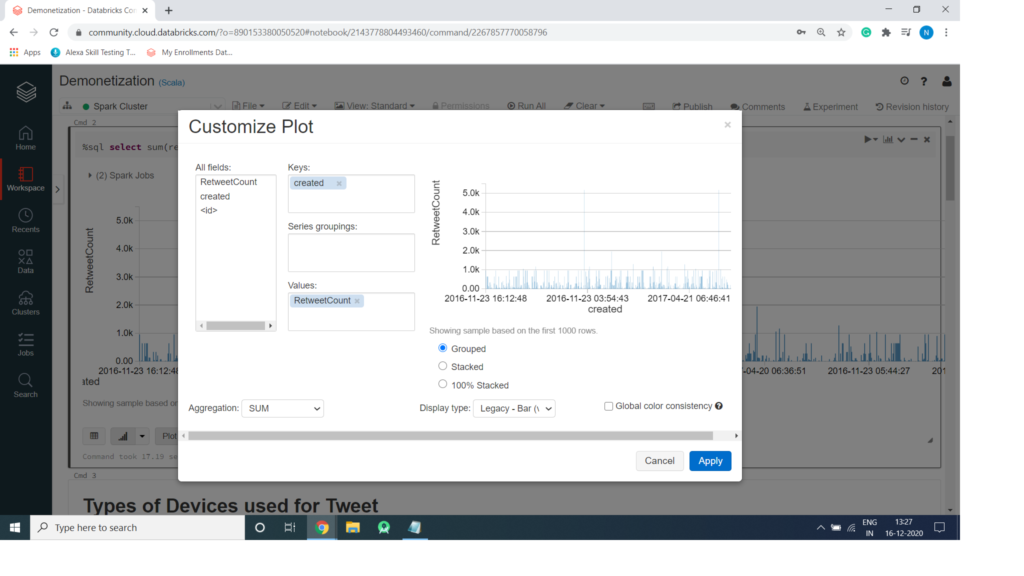
Plot Option for Chart
Code for Spark SQL to get Types of Devices used for Tweet
%sql

select sum(retweetCount), substring_index(substring_index(statusSource, ">", -2),"<",1) as status_source
from demonetization group by substring_index(substring_index(statusSource, ">", -2),"<",1)

Plot Option for Pie Chart

Code for Spark SQL to get Number of Retweet During Demonetization
%sql

select sum(favoriteCount),created
from demonetization group by created

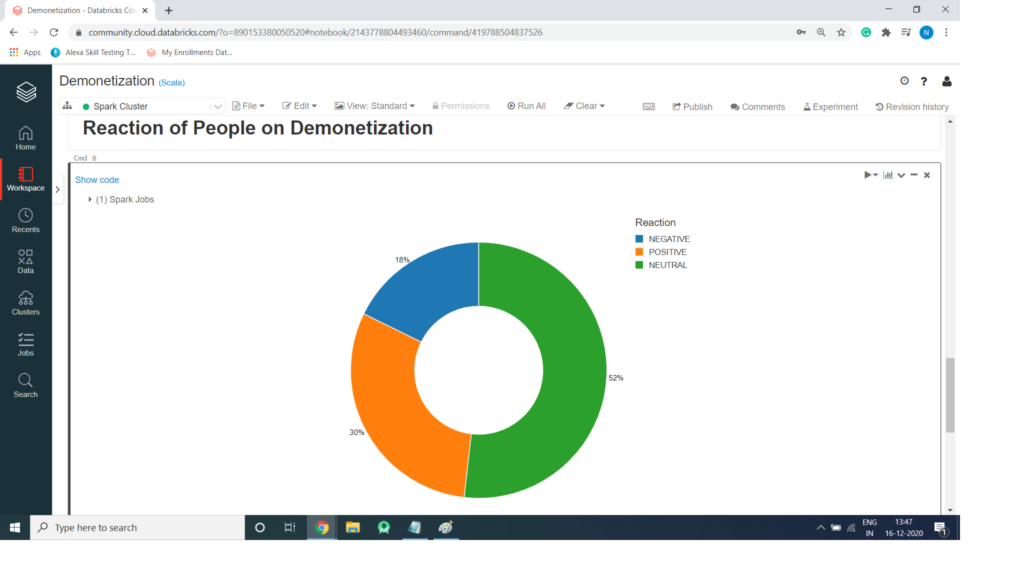
Code for Spark SQL to get Reaction of People on Demonetization
%sql

select CASE
 WHEN text like '%Respect%' THEN "POSITIVE"
 WHEN text like '%symptom%' THEN "POSITIVE"
 WHEN text like '%terrorists%' THEN "POSITIVE"\
 WHEN text like '%National%' THEN "POSITIVE"
 WHEN text like '%reform%' THEN"POSITIVE"
 WHEN text like '%support%' THEN "POSITIVE"
 WHEN text like '%#CorruptionFreeIndia%' THEN "POSITIVE"
 WHEN text like '%respect%' THEN "POSITIVE"
 WHEN text like '%Gandhi%' THEN "POSITIVE"
 WHEN text like '%vote%' THEN "POSITIVE"
 WHEN text like '%fishy%' THEN "NEGATIVE"
 WHEN text like '%disclosure%' THEN "NEGATIVE"
WHEN text like '%Reddy Wedding%' THEN "NEGATIVE"
WHEN text like '%protesting%' THEN "NEGATIVE"
WHEN text like '%hards%' THEN "NEGATIVE"
WHEN text like '%Kerala%' THEN "NEGATIVE"
WHEN text like '%hurt%' THEN "NEGATIVE"
WHEN text like '%USELESS%' THEN "NEGATIVE"
WHEN text like '%Disaster!%' THEN "NEGATIVE"
WHEN text like '%Black%' THEN "NEGATIVE"
WHEN text like '%negative%' THEN "NEGATIVE"
WHEN text like '%impact%' THEN "NEGATIVE"
WHEN text like '%opposing%' THEN "NEGATIVE"
ELSE "NEUTRAL"
     END AS Reaction
from demonetization